Fig. 8
Download original image
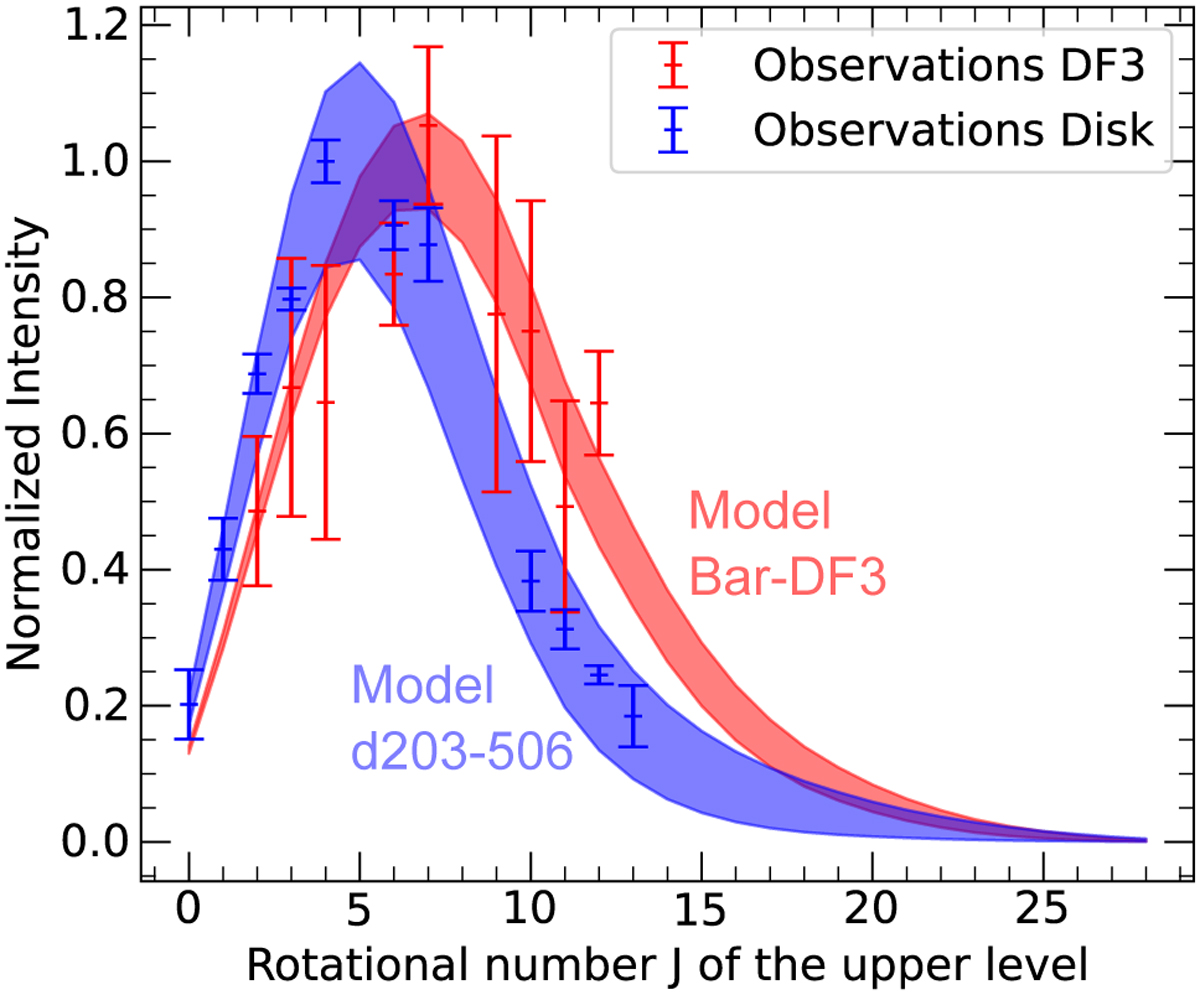
Normalized intensities Ĩij of CH+ rovibrational transitions v = 1 → 0, J → J + 1 following chemical-pumping while considering the observed distribution of H2 and temperature. The red (resp. blue) line corresponds to the intensities of CH+ considering the temperature and H2 population densities in the Bar (resp. in d203-506). The shaded areas indicate the range between the upper and lower limits as determined in Sect. 5.2.1. Red (resp. blue) crosses correspond to the normalized intensities of CH+ transitions observed in the Bar (resp. disk).
Current usage metrics show cumulative count of Article Views (full-text article views including HTML views, PDF and ePub downloads, according to the available data) and Abstracts Views on Vision4Press platform.
Data correspond to usage on the plateform after 2015. The current usage metrics is available 48-96 hours after online publication and is updated daily on week days.
Initial download of the metrics may take a while.