Fig. 6
Download original image
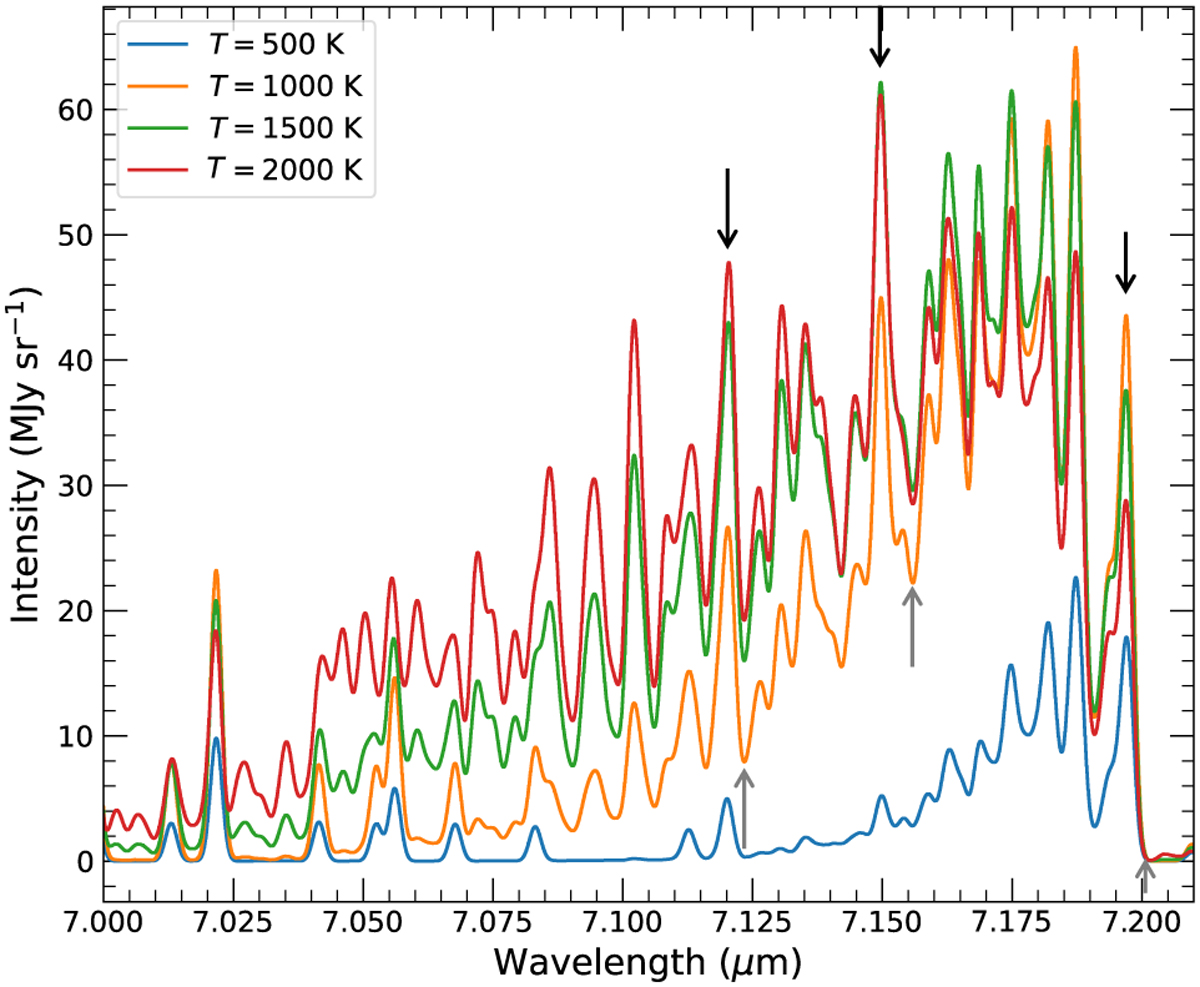
Local thermodynamic equilibrium models of the Q branch of ![]() at a column density of
at a column density of ![]() at different excitation temperatures using the set of spectroscopic constants from Changala et al. (2023). The higher the excitation temperature is, the more intense the lines at shorter wavelengths are. The black (resp. gray) arrows point to the peak (resp. base) of the lines we use for the ratios plotted in Fig. 7.
at different excitation temperatures using the set of spectroscopic constants from Changala et al. (2023). The higher the excitation temperature is, the more intense the lines at shorter wavelengths are. The black (resp. gray) arrows point to the peak (resp. base) of the lines we use for the ratios plotted in Fig. 7.
Current usage metrics show cumulative count of Article Views (full-text article views including HTML views, PDF and ePub downloads, according to the available data) and Abstracts Views on Vision4Press platform.
Data correspond to usage on the plateform after 2015. The current usage metrics is available 48-96 hours after online publication and is updated daily on week days.
Initial download of the metrics may take a while.