| Issue |
A&A
Volume 696, April 2025
|
|
|---|---|---|
| Article Number | A96 | |
| Number of page(s) | 7 | |
| Section | Extragalactic astronomy | |
| DOI | https://doi.org/10.1051/0004-6361/202453332 | |
| Published online | 08 April 2025 | |
Secondary black hole-induced magnetic reconnection in OJ 287: Implications for X-ray and radio emission
1
INAF – Osservatorio Astronomico di Brera, Via E. Bianchi 46, I-23807 Merate, Italy
2
Research Center for Astronomy, Academy of Athens, GR-11527 Athens, Greece
⋆ Corresponding authors; This email address is being protected from spambots. You need JavaScript enabled to view it.
, This email address is being protected from spambots. You need JavaScript enabled to view it.
Received:
6
December
2024
Accepted:
1
March
2025
Abstract
Context. OJ 287, a nearby blazar, has exhibited remarkable variability in its optical light curve since 1888, characterized by 2-year quasi-periodic outbursts. These events are attributed to the orbital dynamics of a supermassive binary black hole system at the heart of the blazar. This study explores the role of magnetic reconnection and the formation of plasmoid chains in driving the energetic processes responsible for OJ 287’s variability. We propose that the passage of the secondary black hole through the magnetic field of the primary black hole’s accretion disk triggers magnetic reconnection, which contributes to the observed X-ray and radio emission features in OJ 287.
Aims. We explore the connection between binary black hole interactions, accretion disk dynamics, and the formation of plasmoid chains as the secondary black hole passes through the magnetic field forest from the accretion disk and the jet of the primary. Magnetic reconnection is the fundamental process behind particle acceleration, potentially influencing the observed emissions and variability, particularly during specific orbital phases of OJ 287.
Methods. Our approach relies on numerical simulations to understand the formation of plasmoid chains resulting from black hole interactions and accretion disk dynamics. Based on such results, we employ simulation outcomes to examine the potential contribution to observed emissions, validating our assumptions about plasmoid chain creation. With this idea, we aim to establish a direct link between numerical simulations and observed emission, particularly in the case of OJ 287.
Results. Our findings confirm that the formation of plasmoid chains coincides with specific anomalous emission events observed in OJ 287. Notably, the radio emission patterns cannot be explained by a single blob model, as the necessary size to mitigate synchrotron self-absorption would be too large. This highlights the complexity of the emission processes and suggests that plasmoid chains could contribute to additional emission components beyond the steady jet.
Key words: radiation mechanisms: non-thermal / relativistic processes / galaxies: active
© The Authors 2025
 Open Access article, published by EDP Sciences, under the terms of the Creative Commons Attribution License (https://creativecommons.org/licenses/by/4.0), which permits unrestricted use, distribution, and reproduction in any medium, provided the original work is properly cited.
This article is published in open access under the Subscribe to Open model. This email address is being protected from spambots. You need JavaScript enabled to view it. to support open access publication.
1. Introduction
Blazars, particularly flat spectrum radio quasars and BL Lac objects, are a unique class of active galactic nucleus (AGN) characterized by relativistic jets that point directly toward Earth. The relativistic motion amplifies their emission across the electromagnetic spectrum, making them some of the most luminous and distant sources in the Universe (Blandford et al. 2019). Their spectral energy distribution (SED) exhibits two distinct “humps”: one extending from radio to optical-UV (and sometimes into the X-ray) bands, and another from X-rays to gamma rays. The lower-energy component is typically attributed to synchrotron emission from nonthermal electrons, while the higher-energy hump is often explained by inverse Compton scattering of either synchrotron photons or external seed photons.
OJ 287, a well-studied blazar at a redshift of z = 0.306, exhibits quasiperiodic optical flares with a remarkable ≈12-year periodicity, attributed to its binary black hole nature Sillanpaa et al. (1988). The system’s primary black hole has a mass of 1.8 × 10¹⁰ M⊙, while the secondary has a mass of 1.5 × 10⁸ M⊙. However, Komossa et al. (2023) put forward a different estimate based on a new theory of energy production in accretion disks. In this theory, all the accretion power is converted into optical, thermal emission from the accretion disk, resulting in luminosities about 100 times higher than the ones predicted by standard models. To reconcile this discrepancy, the authors propose reducing the black hole mass by a factor of 100. Reducing the black hole mass by a factor of 100 was suggested to address this inconsistency. Notably, this discrepancy is not unique to OJ 287 but extends to other AGNs as well, as is discussed by Valtonen et al. (2023c). The orbit is eccentric and tilted, with a semimajor axis of 9300 AU (Laine et al. 2020). The current model, in which a secondary supermassive black hole (SMBH) periodically plunges through the accretion disk of the primary SMBH, provides an explanation for the optical variability observed over more than a century (Valtonen et al. 2008, 2016). In the current theory by Lehto & Valtonen (1996), Ivanov et al. (1998), Valtonen et al. (2019), the role of the magnetic fields is neglected. However, in the recent work by Valtonen et al. (2023b), the need for the magnetic field is introduced as an early stage of the bubble escaping from the perturbed accretion disk. Furthermore, in the pre-flare activity of OJ287, as was reported by Pihajoki et al. (2013), the magnetic fields could play a role.
To address this, we propose that magnetic reconnection, triggered by disrupting the accretion disk’s magnetic field during the secondary’s passage, plays a key role in producing the nonthermal radiation observed at higher energies. As the secondary black hole disturbs the disk and moves close to the jet of the primary, the interaction between the magnetic fields leads to the formation of current sheets and plasmoids – magnetic islands that evolve and release energy through reconnection. These plasmoids, in turn, accelerate particles to relativistic energies. The particles can then radiate synchrotron and inverse Compton emission from the radio to X-ray regimes (Guo et al. 2014; Sironi & Spitkovsky 2014; Ball et al. 2018).
Observationally, the emission mechanism responsible for certain deviations in the V/X flux ratio of OJ 287 remains unclear. The V/X method (Valtonen et al. 2023b) has identified anomalous flux ratios at specific orbital phases, suggesting an additional, non-jet-related emission component. In this work, we investigate whether magnetic reconnection, induced by the secondary’s passage, could be responsible for this variability. This hypothesis is tested through comparisons with observed multiwavelength data, which we discuss in Section 3.
Our model focuses on the evolution of these plasmoids and plasmoid chains1, which are well suited for explaining the nonthermal flares observed in OJ 287. The key is understanding how the secondary black hole’s passage through the primary’s magnetized accretion disk disrupts the magnetic field, generating localized regions of enhanced magnetic energy. In these regions, high magnetization (σ = B2/ρc2) and turbulent conditions lead to efficient particle acceleration, producing relativistic electron distributions capable of emitting synchrotron radiation (Petropoulou et al. 2016; Meringolo et al. 2023). For OJ287, this process mirrors the behavior of AGN jets, in which magnetic reconnection has been shown to be a critical factor in shaping the SED and variability of emissions (Gómez & Traianou 2022; Valtonen et al. 2024). Recent particle-in-cell simulations provide a framework for quantifying the energy release and particle acceleration mechanisms involved in magnetic reconnection events. These simulations demonstrate that plasmoids form naturally in turbulent, high-magnetization environments and can accelerate particles to ultra-relativistic speeds (Sironi et al. 2016; Werner et al. 2018; Li et al. 2023). The rate of magnetic reconnection and the size of the plasmoids are directly linked to the local magnetic field strength, which in turn scales with the properties of the black hole system, such as the mass and spin of the primary SMBH, and the cause of local turbulence that is the secondary SMBH. As energetic particles trapped within the plasmoid chains gain high energies, interactions with the surrounding environment cause energy loss, emitting γ-ray, X-ray, and near-infrared flares (Valtonen et al. 2023b).
In addition, general relativistic magnetohydrodynamic (GRMHD) simulations at increasingly higher resolutions have begun to capture the formation of current sheets and magnetic reconnection near black holes (Ripperda et al. 2020; Nathanail et al. 2020; Chatterjee et al. 2021). These studies highlight how magnetic dissipation in the turbulent disk environment leads to rapid reconnection, which is essential for understanding the variability and energetics of blazar flares. The insights gained from these simulations are crucial for our model, as they provide a detailed picture of how plasmoids evolve and interact with the surrounding plasma, ultimately driving the observed nonthermal emissions.
This paper is organized as follows. In Section 2, we sketch the proposed model, with Section 2.1 focusing on the development of plasmoids and Section 2.2 reporting the details of the emission process. In Section 3, we analyze and discuss the results of our calculations, and in Section 4 we present our conclusions.
2. Plasmoid driven variability in OJ 287 – model details
The accretion disk surrounding the primary black hole in OJ 287 is expected to be magnetized. First, the primary black hole is known to possess a relativistic jet with a helical magnetic field (Gómez & Traianou 2022), suggesting that the magnetic field at the horizon must have been accreted through the inner regions of the disk. This implies that the accretion disk is likely threaded by a large-scale poloidal magnetic field that extends to high altitudes closer to the jet, where the density is expected to be low. Second, this large-scale magnetization is supported by observations and models of jet acceleration and collimation zones, where magnetic fields play a crucial role (Gold et al. 2014; Mizuno et al. 2014). Moreover, previous studies have explored the complex dynamics of the binary system and the role of magnetic fields in triggering various types of emissions. Pihajoki et al. (2013) specifically highlighted how the magnetic interaction between the black holes could drive emissions across different wavelengths. Additionally, polarization data from OJ 287 indicate that the inner jet follows a helical trajectory, consistent with the presence of a helical magnetic field component within the jet’s core, as is seen in VLBI (Very-long-baseline interferometry) observations (Myserlis et al. 2018).
Building on this, our model proposes that, although the magnetic field in the accretion disk of the primary black hole is likely less intense than the jet’s field, it still retains a helical structure. As the secondary black hole approaches and passes through the disk, it disturbs the disk’s magnetic geometry and the magnetic field close to the jet, inducing shocks and triggering intense magnetic reconnection. This reconnection process leads to the formation of plasmoids and plasmoid chains. From the perspective of the secondary black hole, it would appear as though an enormous “magnetic forest” were being accreted from one direction, in contrast to the typical inward rotation of matter in accretion disks. Close to the event horizon of the secondary black hole, regions of high magnetization (σ ≫ 1) would develop, energizing particles and trapping them within plasmoids.
The variability introduced by this reconnection-driven process is further supported by the anomalous trends observed in the V/X method analysis (Valtonen et al. 2023b), which deviates from the expected jet emission ratio. These results, discussed in Section 3, suggest that plasmoid formation and evolution contribute to the observed X-ray and optical variability during the secondary’s passage through the disk and near the jet.
This scenario is based on two high-resolution simulations: one modeling the accretion disk of the primary black hole and the other simulating plasmoid production near a black hole. The dynamics described here can be better understood by visualizing recent simulations (see Fig. 12), where the secondary black hole can be seen entering this complex magnetic environment. Details on the numerical simulations can be found in Appendix A.
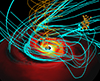 |
Fig. 1. 3D cartoon representation of the accretion flow and magnetic field topology around the primary black hole. The rest-mass density distribution is shown in the equatorial plane using a yellow-to-red color gradient. The jet of the primary black hole is represented by the orange magnetic field lines, while the disk’s magnetic field lines are depicted in cyan, highlighting the regions where magnetic reconnection is expected to occur, leading to plasmoid formation above the accretion disk. The secondary black hole is illustrated as a black circle above the equatorial plane, with the gold blobs representing the expected plasmoids generated by the perturbation of the disk’s magnetic field due to the secondary black hole’s passage. Note that the primary black hole, the disk, and the magnetic field lines were derived from a 3D simulation (Nathanail et al. 2022), with the secondary black hole and plasmoids added ad hoc. |
2.1. Plasmoid chains
Plasmoids form in highly magnetized environments, serving as efficient sites for particle acceleration, which produces high-energy emissions consistent with the variability observed in blazar jets (Sironi et al. 2016). This process is central to our model for OJ 287, where the passage of the secondary black hole through the primary’s magnetized accretion disk induces magnetic reconnection, triggering plasmoid formation. These plasmoids can explain the nonthermal X-ray and radio flares observed in the system, with plasmoid mergers generating multiwavelength flares and polarization variations (Zhang et al. 2024).
For the primary black hole in OJ 287, the gravitational radius and timescale are given by  ,
,  , with the Eddington luminosity,
  erg s−1. For the secondary black hole, the relevant timescale is tg2 = 102.5 s. Recent simulations show plasmoid formation at the boundaries of magnetized funnel regions, with plasmoids typically produced every 500 − 700 tg (Nathanail et al. 2020, 2022; Ripperda et al. 2020, 2022). The plasmoid production rate can be approximated by:
 (1)
(1)
with larger plasmoids forming every 500 tg2 and smaller plasmoids occurring more frequently. Each one of these plasmoids contributes significantly to the overall emission. Plasmoid production is derived from a high-resolution simulation that studies how matter plunging into a black hole leads to plasmoid generation due to the bringing of inverse magnetic field polarity together and forming turbulence (Nathanail et al. 2020). This study informs our assumptions about plasmoids’ energetics, morphology, and evolution during the secondary black hole’s passage through the magnetized environment of the primary’s accretion disk.
A single flare event in OJ 287 has been observed to release between 1047 and 1048 ergs, depending on the wavelength (Marscher & Jorstad 2011; Valtonen et al. 2019). The minimum energy budget for each plasmoid can be estimated by dividing the total flare energy by the number of plasmoids, giving a rough estimate of 1044 − 1045 ergs per plasmoid. While plasmoids possess more magnetic energy than this, only a fraction is radiated in the observed frequencies. The magnetic energy of each plasmoid can be estimated as
 (2)
(2)
These estimates support the idea that a thousand plasmoids can collectively produce the required energy for a flare. More details on the production of plasmoid chains in numerical simulations of black hole accretion can be found in Appendix B. The properties of the plasmoid chains, including their formation timescales, sizes, and expansion velocities, are closely related to the mass and size of the black hole. The energy distribution of electrons within the plasmoids follows a power law, characterized by a high-energy tail contributing to the nonthermal radiation observed in X-rays and radio. Understanding these distributions and scalings with the black hole parameters provides a comprehensive model for the energy budget of OJ 287’s flares. While nonthermal radiation from dual jet interactions between two SMBHs has been discussed previously (Gutiérrez et al. 2024), we focused on the interaction between the secondary black hole and the primary disk’s magnetic field, as this interaction can produce the observed flares.
To investigate the role of plasmoid production in OJ 287, we considered the interaction of the secondary black hole with the primary’s accretion disk. The matter distribution of the primary’s disk, extracted from a high-resolution simulation, provides a reliable basis for our analysis. This simulation accurately captures the density profile and turbulence within the disk, forming the foundation for our understanding of the secondary’s interaction with the disk material. The simulation details can be found in the Appendix A. As was mentioned earlier, the passage of the secondary black hole through the accretion disk of the primary is similar to the procedure of matter plunging onto a stationary black hole, if we move to the rest frame of the secondary black hole, and this situation has been simulated and the results used here (Nathanail et al. 2020).
Figure 2 shows 1D slices of the logarithmic density, log10(ρ), along the height, z, of the accretion disk at various radial distances, x, from the SMBH, with y = 0. Each curve corresponds to a specific value of x (20, 30, 40, 50, and 60). The density profile is maximal at z = 0, corresponding to the disk midplane. However, additional density peaks are observed at higher z values, indicating vertical density variations that may be linked to disk turbulence or structural instabilities. These peaks diminish in magnitude as x increases, suggesting a radial dependency of density stratification within the disk. The height, z, can be understood in terms of the secondary black hole’s trajectory through the primary’s disk. Specifically, phase 1 begins when the black hole enters the disk and then passes through the maximum density region at z = 0, coinciding with the X-ray flare observation. Phase 2 occurs as the black hole exits the interaction region.
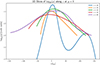 |
Fig. 2. 1D slices of the logarithmic density, log10(ρ), along the vertical height, z, of the accretion disk at various radial distances, x, from the SMBH, with y = 0. The density peaks at the disk midplane, z = 0, but additional maxima at higher or lower heights reveal the vertical structure of the disk. |
2.2. Emission
In the following, we introduce a model based on a chain of plasmoids, which may contribute to particle acceleration and the generation of nonthermal populations. We used simple assumptions as a zero-order approximation to determine whether this model can account for the observed emission data. The broader morphology of the nonthermal SED depends on the ratio of the magnetic to photon energy densities. To calculate the former, we assumed some equipartition with the accreting matter, the energy density. By assuming the power of the accretion, Pacc = ṁMLEdd, with ṁ the mass accretion rate normalized to the Eddington one and M = M1/M⊙ (recall that M1 is the mass of the primary black hole). We assume that ṁ ≈ 0.1, which is consistent with other studies for OJ 287 (Marscher & Jorstad 2011; Valtonen et al. 2019). For example, the nonthermal emissivity, which arises from the synchrotron radiation of relativistic electrons, can be expressed, as in Rybicki & Lightman (1979), as
 (3)
(3)
where σT is the Thomson cross-section, c is the speed of light, K is the normalization factor of the electron distribution that is connected to the electron density, UB is the magnetic energy density, and νL is the Larmor frequency, given by  . According to Ball et al. (2018), the slope of the spectrum concerning the magnetization, σ, and plasma, β, is given by p = Ap + Bptanh(Cpβ), where
  , Bp = 3.7σ−0.19, Cp = 23.4σ0.26. Moreover, the electron nonthermal efficiency with respect to the magnetization, σ, and plasma, β, is ϵ = Aϵ + Bϵtanh(Cϵβ), where
  , Bϵ = 0.64σ0.07, Cϵ = −68σ0.13. To model particle radiation, we calculated the electron distribution fraction from the kinetic equation, which describes the losses and/or sinks and injection of relativistic electrons from the acceleration zone (Qe) Boula & Mastichiadis (2022), more details in the Appendix C.
Observational evidence reveals that the X-ray emission before and after the flare remains almost steady, suggesting that it originates from the accretion disk Komossa et al. (2021). In contrast, the variability observed in the radio emission points to the presence of a nonthermal particle distribution. We employed a simplified approach – although stochastic models can also be used – to reproduce this radio variability and assume spherical plasmoids (blobs) as representative structures. Each plasmoid shares the same physical parameters (see Table 1 – electron luminosity and magnetic field strength decrease linearly with time) but follows a particle density distribution trend inspired by Fig. 2. This trend implies that the density distribution is asymmetric relative to the disk midplane, likely due to perturbations caused by the secondary black hole passing through the accretion disk.
Average parameter values of plasmoids.
The emission from each plasmoid was calculated as it evolved and expanded, and we normalized this emission by scaling to match the observed total number of plasmoids. These plasmoid families, introduced at discrete time intervals, serve to capture the overall observed variability trends. At the same time, the X-rays that are produced by the blobs do not violate the steady-state emission. For the X-ray flare, we modeled a temporal increase in particle density (and consequently Le) within each plasmoid, following the density evolution shown in Fig. 2, which indicates an 80 times increase, according to the observations. In this case, the source becomes optically thin at radio frequencies due to synchrotron self-absorption (SSA).
3. Results and discussion
To explain the variability of OJ287, several models have been proposed, including a varying accretion rate, a low-density cavity, and a precessing jet (Katz 1997; Tanaka 2013; Britzen et al. 2018). While these models offer insights, significant attention has been given to the high-energy emission from blazars. Our analysis focuses on the period from 2019 to 2021, covering a crucial phase of the secondary black hole’s orbit. The starting point corresponds to the secondary’s passage through the primary’s accretion disk, while the concluding phase occurs as the secondary moves near the primary’s relativistic jet. Notably, an emission event is observed around 2020, coinciding with the time frame in which the secondary’s trajectory brings it into a magnetized environment influenced by both the disk and jet regions.
The formation and evolution of plasmoids are described in Section 2.1, while the emission mechanisms are detailed in Section 2.2. Our results suggest that the primary emission spot is located approximately 5000 AU, corresponding to a distance of 1016.9 cm from the primary black hole. Additionally, we considered a secondary spot at 3250 AU, corresponding to 1016.7 cm.
The derived blob sizes are roughly an order of magnitude smaller than the primary black hole’s Schwarzschild radius (almost an order of magnitude larger than the secondary). The radio emission likely originates from an optically thin region, where SSA becomes less significant and radio photons can escape. If this emission stems from a single plasmoid, we expect a region of approximately 1017 cm. However, this would violate the event horizon constraints of the black hole, supporting the concept of a plasmoid chain.
In our scenario, we estimate around a thousand plasmoids in total. Some of them are produced during phase 1, when the secondary black hole penetrates the primary’s accretion disk. This specific interaction corresponds to the equatorial crossing that occurred around 20193 and is at the beginning of the observations in Fig. 3, which aligns with the quasi-Keplerian orbital sequence described by Valtonen et al. (2023a); Valtonen et al. (2024). Plasmoid properties vary, leading to different contributions to the overall variability. This zero-order approach provides a framework for determining the maximum plasmoid size and the minimum number required for such variability. According to the plasmoid creation rate in Eq. (1), the plasmoid population can grow over time, explaining the observed fluctuations. As the particle density increases, we can account for the onset of the X-ray flare. The region responsible for these flares remains optically thick to radio frequencies due to SSA. During phase 2, as the secondary black hole exits the disk, the overall luminosity decreases, followed by another radio flare, similar to phase 1. Table 1 summarizes the averaged parameter values used in this analysis, which align well with the plasmoid properties described in Section 2.1.
Figure 3 shows the modeled lightcurve of X-ray and radio emission. Our model suggests that high-energy photons escape first, followed by lower-frequency emission. While the radio emission from the X-ray-producing region is not prominent in the figure due to SSA, the overall emission trend remains consistent. These results are indicative, and various combinations of plasmoid properties can account for the total variability observed in the source. Figure 4 highlights anomalous FV/FX values that deviate from the typical jet-dominated emission range. These anomalies coincide with the secondary black hole’s passage through the accretion disk of the primary in 2019 and its subsequent interaction near the jet region in 2020. The V-band to X-ray flux ratio during this period, plotted in Fig. 4, exhibits significant deviations following the secondary’s passage. This behavior aligns with the expectations from the V/X method (Valtonen et al. 2021, 2023b), which identifies departures from the standard jet emission profile. In particular, the shift in the V/X ratio suggests that an additional emission mechanism, distinct from the steady jet emission, may be at play. One possible explanation for these deviations is the contribution of magnetic reconnection-driven plasmoid formation, which could enhance variability during these phases.
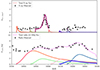 |
Fig. 3. Radio and X-ray lightcurves of OJ287 variability in 2019, the points represent the observational trend. We show the total emission from different blob families as they evolve in time. |
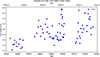 |
Fig. 4. Ratio of optical (V-band) to X-ray flux (FV/FX) for OJ 287 as a function of time. The data points were derived from Swift observations and ground-based V-band measurements. |
It is important to note that this is a simplified or “toy” model. We deliberately avoid complex mechanisms such as bremsstrahlung, which have been discussed in the literature (Valtonen et al. 2012; Yarza et al. 2020), and do not explore the detailed role of the accretion disk. While the disk’s structure may influence our results, it is outside the scope of this study. For instance, studies like (Tavecchio et al. 1998) have explored the origins of high-energy radiation in blazar jets and given constraints on the physical parameters that are relevant to understanding OJ 287’s multiwavelength variability. Future work could further explore how disk properties impact the plasmoid dynamics and emission processes.
4. Conclusions
In this letter, we present a simple model to explain the variability of OJ 287 through the formation of plasmoid chains. Beyond the observed variability, our model also provides a possible explanation for the anomalous V/X flux ratio, suggesting that magnetic reconnection during the secondary’s passage contributes to additional emission components.
-
As the secondary black hole passes through the accretion disk and subsequently moves close to the jet of the primary, it disturbs the magnetic geometry, inducing shocks and triggering intense magnetic reconnection, leading to the formation of plasmoids and plasmoid chains.
-
From the perspective of the secondary black hole, this magnetic reconnection process appears as though a large magnetic forest is being accreted, contrasting with the usual inward accretion of matter.
-
Our numerical simulations suggest plasmoids’ formation and size distribution, providing a plausible confirmation of the model, consistent with values found in the literature.
-
A simple approach combining synchrotron emission and inverse Compton scattering can account for the observed variability in OJ 287.
-
We acknowledge that in a more realistic scenario the size of the plasmoids is stochastic and the required energy for such plasmoids is variable. However, our model presents a general trend.
One can produce and energize a whole series of plasmoids along the current sheet, i.e., a “plasmoid chain”.
The magnetic field around the black a random vector field has perturbed hole with a Gaussian profile to model the influence of the secondary black hole on the disk’s magnetic structure.
The phase angle, ϕi, associated with this crossing is approximately 313°, derived from the quasi-Keplerian model parameters: an orbital period of 12.13 years, an eccentricity of e = 0.65, and a pericenter precession of 38° per orbit. The timing of this crossing was calculated using the relation:  , with ϕi linked to the forward precession per orbit. This event occurred near the epoch 2019.57. These parameters are critical for determining the precise timing and geometry of the secondary black hole’s disk crossings Valtonen et al. (2023a); Valtonen et al. (2024).
Acknowledgments
We would like to thank the anonymous referee, for their constructive comments. Furthermore, we thank Apostolos Mastichiadis and Fabrizio Tavecchio for the fruitful discussion and comments. This work was supported by computational time granted from the National Infrastructures for Research and Technology S.A. (GRNET S.A.) in the National HPC facility – ARIS – under project ID 16033.
References
- Ball, D., Sironi, L., & Özel, F. 2018, ApJ, 862, 80 [Google Scholar]
- Blandford, R., Meier, D., & Readhead, A. 2019, ARA&A, 57, 467 [NASA ADS] [CrossRef] [Google Scholar]
- Boula, S., & Mastichiadis, A. 2022, A&A, 657, A20 [NASA ADS] [CrossRef] [EDP Sciences] [Google Scholar]
- Britzen, S., Fendt, C., Witzel, G., et al. 2018, MNRAS, 478, 3199 [NASA ADS] [Google Scholar]
- Chatterjee, K., Markoff, S., Neilsen, J., et al. 2021, MNRAS, 507, 5281 [NASA ADS] [CrossRef] [Google Scholar]
- Fishbone, L. G., & Moncrief, V. 1976, ApJ, 207, 962 [NASA ADS] [CrossRef] [Google Scholar]
- Giannios, D. 2013, MNRAS, 431, 355 [NASA ADS] [CrossRef] [Google Scholar]
- Gold, R., Paschalidis, V., Etienne, Z. B., Shapiro, S. L., & Pfeiffer, H. P. 2014, Phys. Rev. D, 89, 064060 [NASA ADS] [CrossRef] [Google Scholar]
- Gómez, J. L., Traianou, E., et al. 2022, ApJ, 924, 122 [Google Scholar]
- Guo, F., Li, H., Daughton, W., & Liu, Y.-H. 2014, Phys. Rev. Lett., 113, 155005 [Google Scholar]
- Gutiérrez, E. M., Combi, L., Romero, G. E., & Campanelli, M. 2024, MNRAS, 532, 506 [CrossRef] [Google Scholar]
- Igumenshchev, I. V. 2008, ApJ, 677, 317 [NASA ADS] [CrossRef] [Google Scholar]
- Igumenshchev, I. V., Narayan, R., & Abramowicz, M. A. 2003, ApJ, 592, 1042 [Google Scholar]
- Ivanov, P. B., Igumenshchev, I. V., & Novikov, I. D. 1998, ApJ, 507, 131 [NASA ADS] [CrossRef] [Google Scholar]
- Katz, J. I. 1997, ApJ, 478, 527 [NASA ADS] [CrossRef] [Google Scholar]
- Komossa, S., Grupe, D., Kraus, A., et al. 2021, Universe, 7, 261 [NASA ADS] [CrossRef] [Google Scholar]
- Komossa, S., Grupe, D., Kraus, A., et al. 2023, MNRAS, 522, L84 [NASA ADS] [CrossRef] [Google Scholar]
- Laine, S., Dey, L., Valtonen, M., et al. 2020, ApJ, 894, L1 [NASA ADS] [CrossRef] [Google Scholar]
- Lehto, H. J., & Valtonen, M. J. 1996, ApJ, 460, 207 [NASA ADS] [CrossRef] [Google Scholar]
- Li, X., Guo, F., Liu, Y.-H., & Li, H. 2023, ApJ, 954, L37 [NASA ADS] [Google Scholar]
- Marscher, A. P., & Jorstad, S. G. 2011, ApJ, 729, 26 [Google Scholar]
- McKinney, J. C., & Gammie, C. F. 2004, ApJ, 611, 977 [Google Scholar]
- Meringolo, C., Cruz-Osorio, A., Rezzolla, L., & Servidio, S. 2023, ApJ, 944, 122 [NASA ADS] [CrossRef] [Google Scholar]
- Mizuno, Y., Hardee, P. E., & Nishikawa, K.-I. 2014, ApJ, 784, 167 [Google Scholar]
- Myserlis, I., Komossa, S., Angelakis, E., et al. 2018, A&A, 619, A88 [NASA ADS] [CrossRef] [EDP Sciences] [Google Scholar]
- Nathanail, A., Fromm, C. M., Porth, O., et al. 2020, MNRAS, 495, 1549 [Google Scholar]
- Nathanail, A., Mpisketzis, V., Porth, O., Fromm, C. M., & Rezzolla, L. 2022, MNRAS, 513, 4267 [NASA ADS] [CrossRef] [Google Scholar]
- Olivares, H., Porth, O., Davelaar, J., et al. 2019, A&A, 629, A61 [NASA ADS] [CrossRef] [EDP Sciences] [Google Scholar]
- Petropoulou, M., Giannios, D., & Sironi, L. 2016, MNRAS, 462, 3325 [NASA ADS] [CrossRef] [Google Scholar]
- Pihajoki, P., Valtonen, M., & Ciprini, S. 2013, MNRAS, 434, 3122 [CrossRef] [Google Scholar]
- Porth, O., Olivares, H., Mizuno, Y., et al. 2017, Comput. Astrophys. Cosmol., 4, 1 [Google Scholar]
- Ripperda, B., Bacchini, F., & Philippov, A. A. 2020, ApJ, 900, 100 [NASA ADS] [CrossRef] [Google Scholar]
- Ripperda, B., Liska, M., Chatterjee, K., et al. 2022, ApJ, 924, L32 [NASA ADS] [CrossRef] [Google Scholar]
- Rybicki, G. B., & Lightman, A. P. 1979, Radiative Processes in Astrophysics (New York: Wiley) [Google Scholar]
- Sillanpaa, A., Haarala, S., Valtonen, M. J., Sundelius, B., & Byrd, G. G. 1988, ApJ, 325, 628 [NASA ADS] [CrossRef] [Google Scholar]
- Sironi, L., & Spitkovsky, A. 2014, ApJ, 783, L21 [NASA ADS] [CrossRef] [Google Scholar]
- Sironi, L., Giannios, D., & Petropoulou, M. 2016, MNRAS, 462, 48 [NASA ADS] [CrossRef] [Google Scholar]
- Tanaka, T. L. 2013, MNRAS, 434, 2275 [NASA ADS] [CrossRef] [Google Scholar]
- Tavecchio, F., Maraschi, L., & Ghisellini, G. 1998, ApJ, 509, 608 [Google Scholar]
- Tchekhovskoy, A., Narayan, R., & McKinney, J. C. 2011, MNRAS, 418, L79 [NASA ADS] [CrossRef] [Google Scholar]
- Valtonen, M. J., Lehto, H., Nilsson, K., et al. 2008, Nature, 452, 851 [NASA ADS] [CrossRef] [Google Scholar]
- Valtonen, M. J., Ciprini, S., & Lehto, H. J. 2012, MNRAS, 427, 77 [NASA ADS] [CrossRef] [Google Scholar]
- Valtonen, M. J., Zola, S., Ciprini, S., et al. 2016, ApJ, 819, L37 [NASA ADS] [CrossRef] [Google Scholar]
- Valtonen, M. J., Zola, S., Pihajoki, P., Enestam, S., et al. 2019, ApJ, 882, 88 [CrossRef] [Google Scholar]
- Valtonen, M. J., Dey, L., Gopakumar, A., et al. 2021, Galaxies, 10, 1 [NASA ADS] [CrossRef] [Google Scholar]
- Valtonen, M. J., Zola, S., Gopakumar, A., et al. 2023a, MNRAS, 521, 6143 [NASA ADS] [CrossRef] [Google Scholar]
- Valtonen, M. J., Dey, L., Gopakumar, A., et al. 2023b, Galaxies, 11, 82 [NASA ADS] [CrossRef] [Google Scholar]
- Valtonen, M. J., Zola, S., Gopakumar, A., et al. 2023c, MNRAS, 525, 1153 [CrossRef] [Google Scholar]
- Valtonen, M. J., Zola, S., Gupta, A. C., et al. 2024, ApJ, 968, L17 [NASA ADS] [Google Scholar]
- Werner, G. R., Uzdensky, D. A., Begelman, M. C., Cerutti, B., & Nalewajko, K. 2018, MNRAS, 473, 4840 [Google Scholar]
- Yarza, R., Wong, G. N., Ryan, B. R., & Gammie, C. F. 2020, ApJ, 898, 50 [Google Scholar]
- Zhang, H., Dong, L., & Giannios, D. 2024, MNRAS, 531, 4781 [NASA ADS] [CrossRef] [Google Scholar]
Appendix A: Numerical simulation setup
In this study, the simulations are conducted in 3D space using the BHAC code Porth et al. (2017), Olivares et al. (2019))4, which employs modified Kerr-Schild coordinates (McKinney & Gammie 2004) and incorporates 2–3 levels of adaptive mesh refinement. The simulation units are chosen such that c = G = 1, meaning the black hole mass is used as the unit of length, with the gravitational radius rg = M, and the grid resolution is set to 384 × 192 × 192 cells along the r, θ, and ϕ axes, respectively.
The initial setup consists of a torus in hydrodynamic equilibrium, as described by Fishbone & Moncrief (1976), with a constant specific angular momentum of l = 6.76, orbiting a Kerr black hole with a dimensionless spin parameter a = 0.94. The disk’s inner edge is located at rin = 20M, while the maximum density is at rmax = 40M. The equation of state is ideal with an adiabatic index of γ = 4/3. Additionally, the magnetic field is initialized as a nested loop structure, defined by the vector potential:
 (A.1)
(A.1)
where ρmax is the maximum rest-mass density in the torus.
The simulations evolve into a Magnetically Arrested Disk (MAD) state, where the poloidal magnetic flux is advected toward the black hole by the accreting gas. As the magnetic pressure builds up, it eventually becomes strong enough to counterbalance the ram pressure of the accreting disk material (Igumenshchev et al. 2003; Igumenshchev 2008; Tchekhovskoy et al. 2011). At this point, when the magnetic pressure and ram pressure reach an equipartition state, gas accretion is significantly hindered, and further accretion can only occur via 3D non-axisymmetric processes. To ensure accurate density distributions, the simulation is allowed to run until it reaches a quasi-stationary MAD state. By time 30000M, we are confident that the system has reached this state, and at this point, the data is exported for analysis. Specifically, the exported data is used to generate Fig. 1, which provides a 3D visualization of the accretion disk, and Fig. 2, which shows the vertical density distribution for different radial distances across the disk.
Appendix B: Details for plasmoid chains
Plasmoids that evolve within highly magnetized environments serve as efficient sites for particle acceleration, producing high-energy emissions consistent with the observed variability in blazar jets (Sironi et al. 2016). This process aligns well with our model for OJ 287, where the passage of the secondary black hole through the primary’s magnetized accretion disk disturbs the magnetic field, triggering reconnection events and the formation of plasmoid chains. The particle acceleration within these plasmoids can explain the nonthermal X-ray and radio flares observed in the system. Additionally, plasmoid mergers during magnetic reconnection can produce significant multiwavelength flares and polarization variations (Zhang et al. 2024).
Plasmoids are frequently produced in reconnection layers during magnetic reconnection events in turbulent black hole accretion flows. Recent simulations indicate that as magnetic field lines are advected toward the black hole, plasmoids frequently form at the boundaries of highly magnetized funnel regions (Nathanail et al. 2020; Ripperda et al. 2020, 2022; Nathanail et al. 2022). Their formation is closely tied to current sheet structures that develop and fragment during the accretion process near the black hole, typically in a region spanning 2 − 15 rg. These simulations show that magnetic reconnection near the black hole can efficiently produce macroscopic, filamentary plasmoids with lengths of ∼10 − 15 rg and diameters of ∼3 − 5 rg. They are generated approximately every 500 − 700 tg and generally do not survive as compact structures beyond a spherical region of ≈30 rg from the event horizon. Smaller plasmoids, with lengths of 4 − 6 rg and diameters of ∼2 − 3 rg, are produced more frequently, approximately every 10 − 20 tg (Nathanail et al. 2022). As plasmoids grow, they accumulate internal energy, expanding due to the decreasing external pressure and density, which accelerates them. The most energetic plasmoids eventually become unbound from the black hole’s gravitational influence. Large plasmoids can reach radii of up to ≈50 rg during their evolution.
The frequency and energy budget of plasmoid production are critical to explaining the high- energy variability observed in OJ 287. GRMHD simulations and theoretical models suggest that the plasmoid formation rate scales with the black hole’s gravitational timescale. Over a period of 105 to 2 × 10⁵ gravitational timescales (tg2), approximately 1000 plasmoids are produced. Both simulations support this plasmoid production rate and prior studies on magnetic reconnection in relativistic environments (Giannios 2013; Petropoulou et al. 2016). Equation 1 suggests that a new plasmoid forms approximately every 500 tg2 which would correspond to 5 tg1. Note that this estimate refers to much larger plasmoids comparable in size to the secondary black hole. Smaller structures form more frequently but have negligible energy and are not considered here.
Appendix C: Emission modelling
Using the code from Boula & Mastichiadis (2022), which solves the kinetic electron kinetic equations under the assumptions presented in the main text of this paper and the specified environmental conditions, we construct a self-consistent one-zone expanding leptonic model to study the connection between radio emission and higher frequency emission. The kinetic equation of electrons reads:
![Mathematical equation: $$ \begin{aligned} \frac{\partial n({\gamma },t)}{\partial t}+\frac{\partial \left[{L(\gamma ,t)}n(\gamma ,t)\right]}{\partial {\gamma }}+\frac{n(\gamma ,t)}{t_{\rm esc}} = Q_e({\gamma },\,t), \end{aligned} $$](/articles/aa/full_html/2025/04/aa53332-24/aa53332-24-eq12.gif) (C.1)
(C.1)
where n(γ, t) the differential number density of electrons of energy γ in the interval dγ, and L(γ, t) represents the loss term, which include synchrotron losses Asyn, inverse Compton scattering losses AICS, and adiabatic expansion losses Aexp and reads: L(γ, t) = (Asyn(γ, t)+AICS(γ, t)+Aexp(γ, t)). The magnetic field strength is derived from the source’s accretion power, assuming equipartition with the kinetic energy density of the accreted mass.
The luminosity of injected electrons:
 (C.2)
(C.2)
where ηe is a proportionality constant, and γmin, γmax are the minimum and maximum electron Lorentz factors.
All Tables
All Figures
|
Fig. 1. 3D cartoon representation of the accretion flow and magnetic field topology around the primary black hole. The rest-mass density distribution is shown in the equatorial plane using a yellow-to-red color gradient. The jet of the primary black hole is represented by the orange magnetic field lines, while the disk’s magnetic field lines are depicted in cyan, highlighting the regions where magnetic reconnection is expected to occur, leading to plasmoid formation above the accretion disk. The secondary black hole is illustrated as a black circle above the equatorial plane, with the gold blobs representing the expected plasmoids generated by the perturbation of the disk’s magnetic field due to the secondary black hole’s passage. Note that the primary black hole, the disk, and the magnetic field lines were derived from a 3D simulation (Nathanail et al. 2022), with the secondary black hole and plasmoids added ad hoc. |
| In the text | |
|
Fig. 2. 1D slices of the logarithmic density, log10(ρ), along the vertical height, z, of the accretion disk at various radial distances, x, from the SMBH, with y = 0. The density peaks at the disk midplane, z = 0, but additional maxima at higher or lower heights reveal the vertical structure of the disk. |
| In the text | |
|
Fig. 3. Radio and X-ray lightcurves of OJ287 variability in 2019, the points represent the observational trend. We show the total emission from different blob families as they evolve in time. |
| In the text | |
|
Fig. 4. Ratio of optical (V-band) to X-ray flux (FV/FX) for OJ 287 as a function of time. The data points were derived from Swift observations and ground-based V-band measurements. |
| In the text | |
Current usage metrics show cumulative count of Article Views (full-text article views including HTML views, PDF and ePub downloads, according to the available data) and Abstracts Views on Vision4Press platform.
Data correspond to usage on the plateform after 2015. The current usage metrics is available 48-96 hours after online publication and is updated daily on week days.
Initial download of the metrics may take a while.