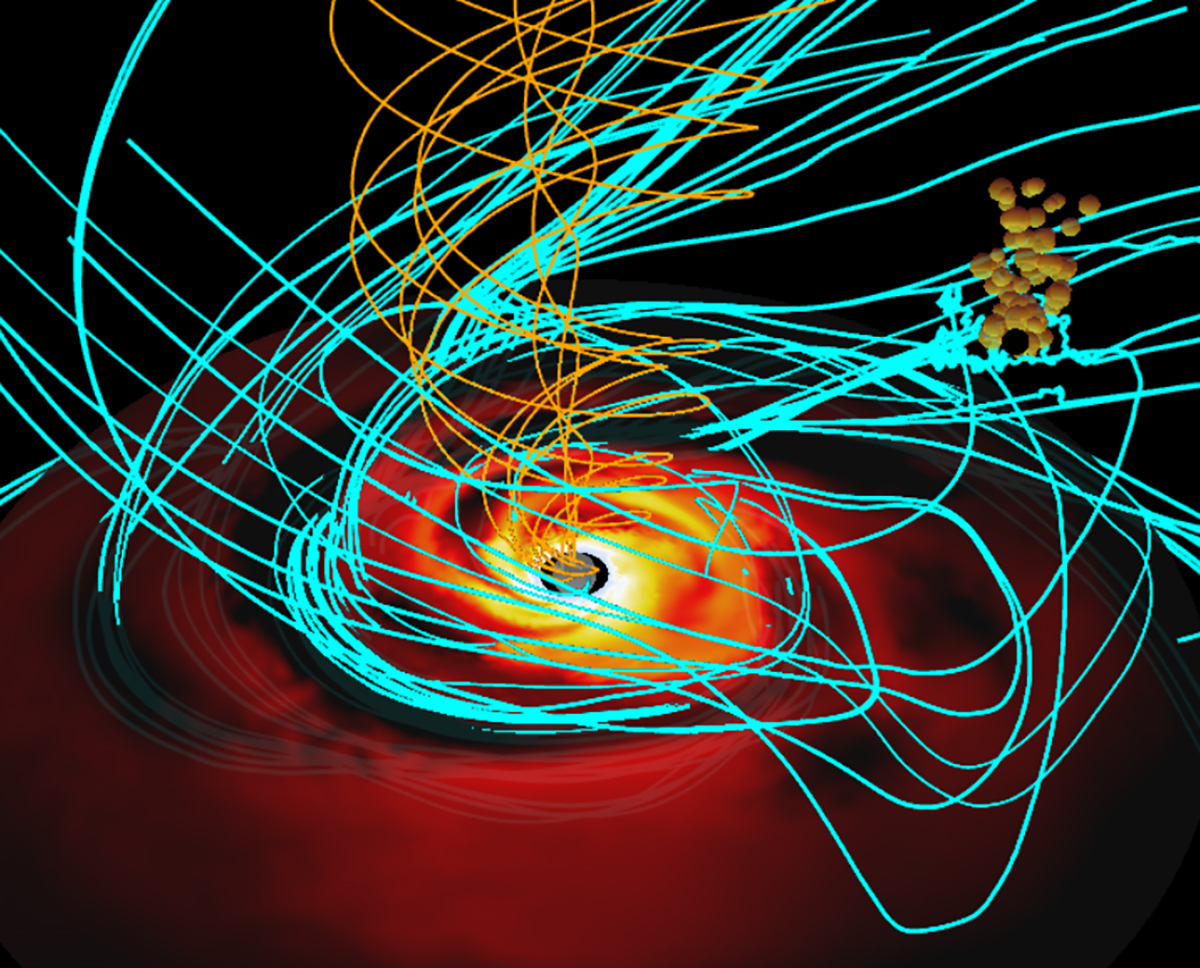
Fig. 1.
Download original image
3D cartoon representation of the accretion flow and magnetic field topology around the primary black hole. The rest-mass density distribution is shown in the equatorial plane using a yellow-to-red color gradient. The jet of the primary black hole is represented by the orange magnetic field lines, while the disk’s magnetic field lines are depicted in cyan, highlighting the regions where magnetic reconnection is expected to occur, leading to plasmoid formation above the accretion disk. The secondary black hole is illustrated as a black circle above the equatorial plane, with the gold blobs representing the expected plasmoids generated by the perturbation of the disk’s magnetic field due to the secondary black hole’s passage. Note that the primary black hole, the disk, and the magnetic field lines were derived from a 3D simulation (Nathanail et al. 2022), with the secondary black hole and plasmoids added ad hoc.
Current usage metrics show cumulative count of Article Views (full-text article views including HTML views, PDF and ePub downloads, according to the available data) and Abstracts Views on Vision4Press platform.
Data correspond to usage on the plateform after 2015. The current usage metrics is available 48-96 hours after online publication and is updated daily on week days.
Initial download of the metrics may take a while.