Fig. 8
Download original image
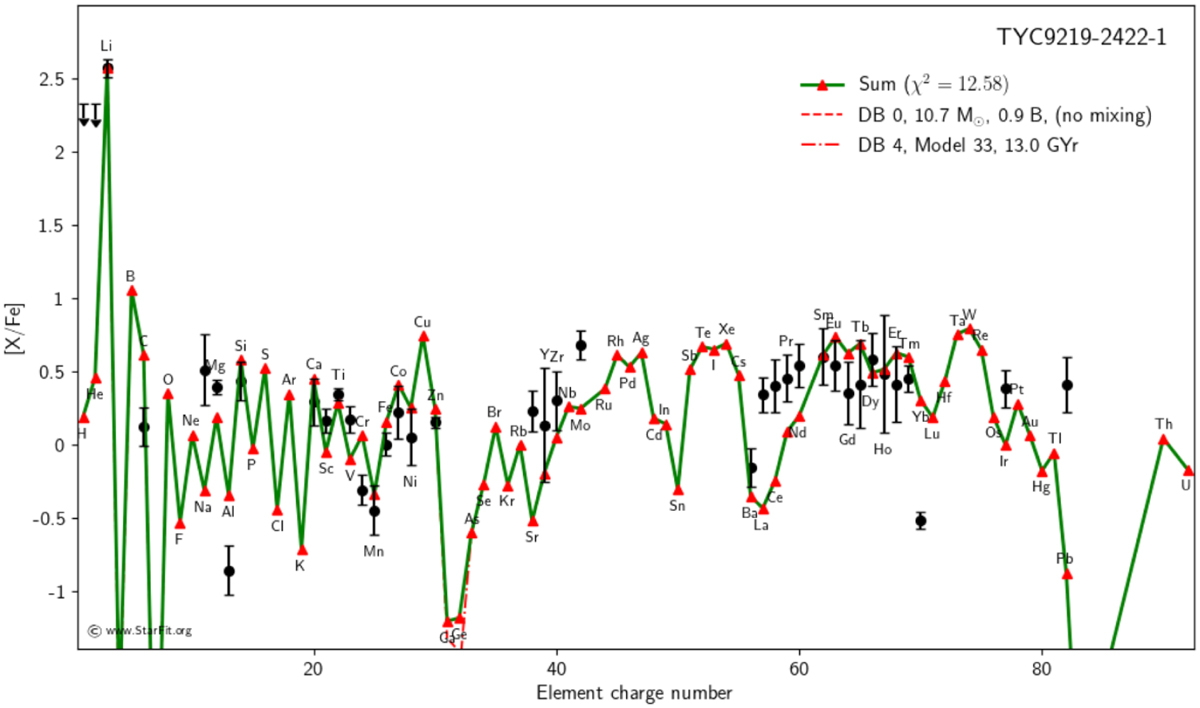
Model fit using starfit for the abundances of TYC 9219-2422-1. The dashed line is a model from the DB0 database of pop III progenitor stars from Heger & Woosley (2010) and later updates. The dash-dotted line is a model from the DB3 database of NSM r-process models from Mendoza-Temis et al. (2015) and Wu et al. (2016). Model 33, which best fits the neutron-capture abundances here, is a NSM model that forms a black hole of about 3M⊙ with a torus ejecta of 0.10M⊙ (for more details see model m0.10 in Wu et al. 2016). The black points are the observed abundances. The green line with red triangles is the sum of the two best-fitting models.
Current usage metrics show cumulative count of Article Views (full-text article views including HTML views, PDF and ePub downloads, according to the available data) and Abstracts Views on Vision4Press platform.
Data correspond to usage on the plateform after 2015. The current usage metrics is available 48-96 hours after online publication and is updated daily on week days.
Initial download of the metrics may take a while.