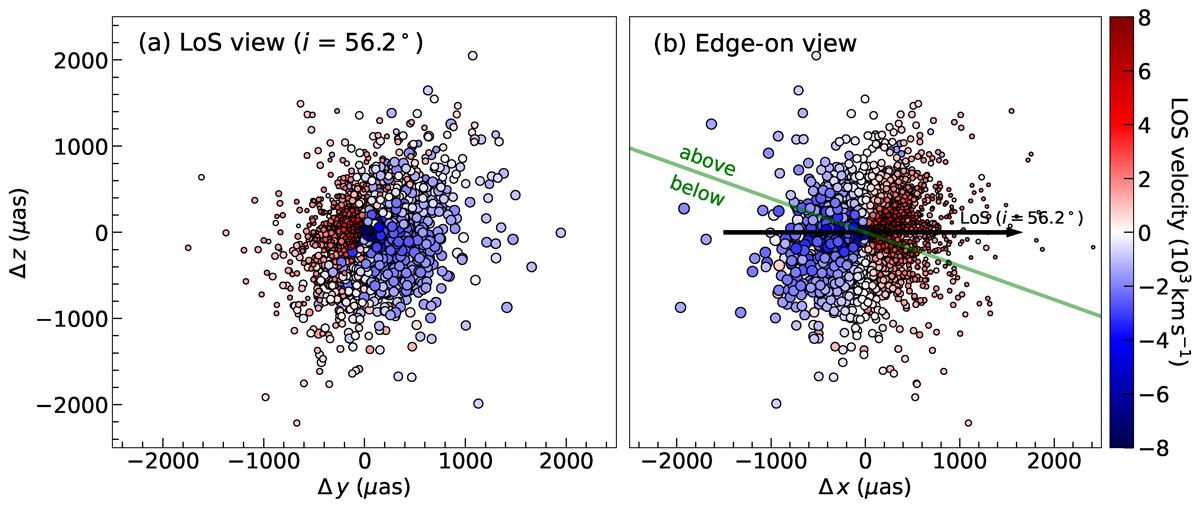
Fig. 8.
Download original image
The cloud distribution of the best-fit BLR model of ID#1 (SDSS J121843.39+153617.2) shown in two different views: (a) line-of-sight (LoS) or face-on view at the best-fit inclination angle i = 54.6° and (b) edge-on view. The PA of the BLR model to generate the cloud distribution is set so that the BLR is perpendicular to the UT4–UT1 baseline to achieve the maximum possible expected differential phase signal on the baseline. The BLR centre is positioned at the origin. The colour of each cloud refers to the LoS velocity, while the size of each cloud refers to the weight of each cloud on the total emission: the larger the size, the greater its contribution to the broad line emission. The green line on the edge-on view depicts the midplane of the BLR, while the black arrow depicts the LoS of the observer (i.e. the observer is on the +Δx direction). The LoS is tilted by i which is measured from the line perpendicular to the midplane. Since i > θ0, the observed flux spectrum is double-peaked. The number of clouds above and below the midplane are the same due to the small midplane opacity. However, the blueshifted clouds have a larger size than the redshifted clouds, indicating the preference of the BLR emission to originate from the far side of the BLR. This explains the relatively strong blueshifted peak of the flux spectrum compared to the redshifted bump.
Current usage metrics show cumulative count of Article Views (full-text article views including HTML views, PDF and ePub downloads, according to the available data) and Abstracts Views on Vision4Press platform.
Data correspond to usage on the plateform after 2015. The current usage metrics is available 48-96 hours after online publication and is updated daily on week days.
Initial download of the metrics may take a while.