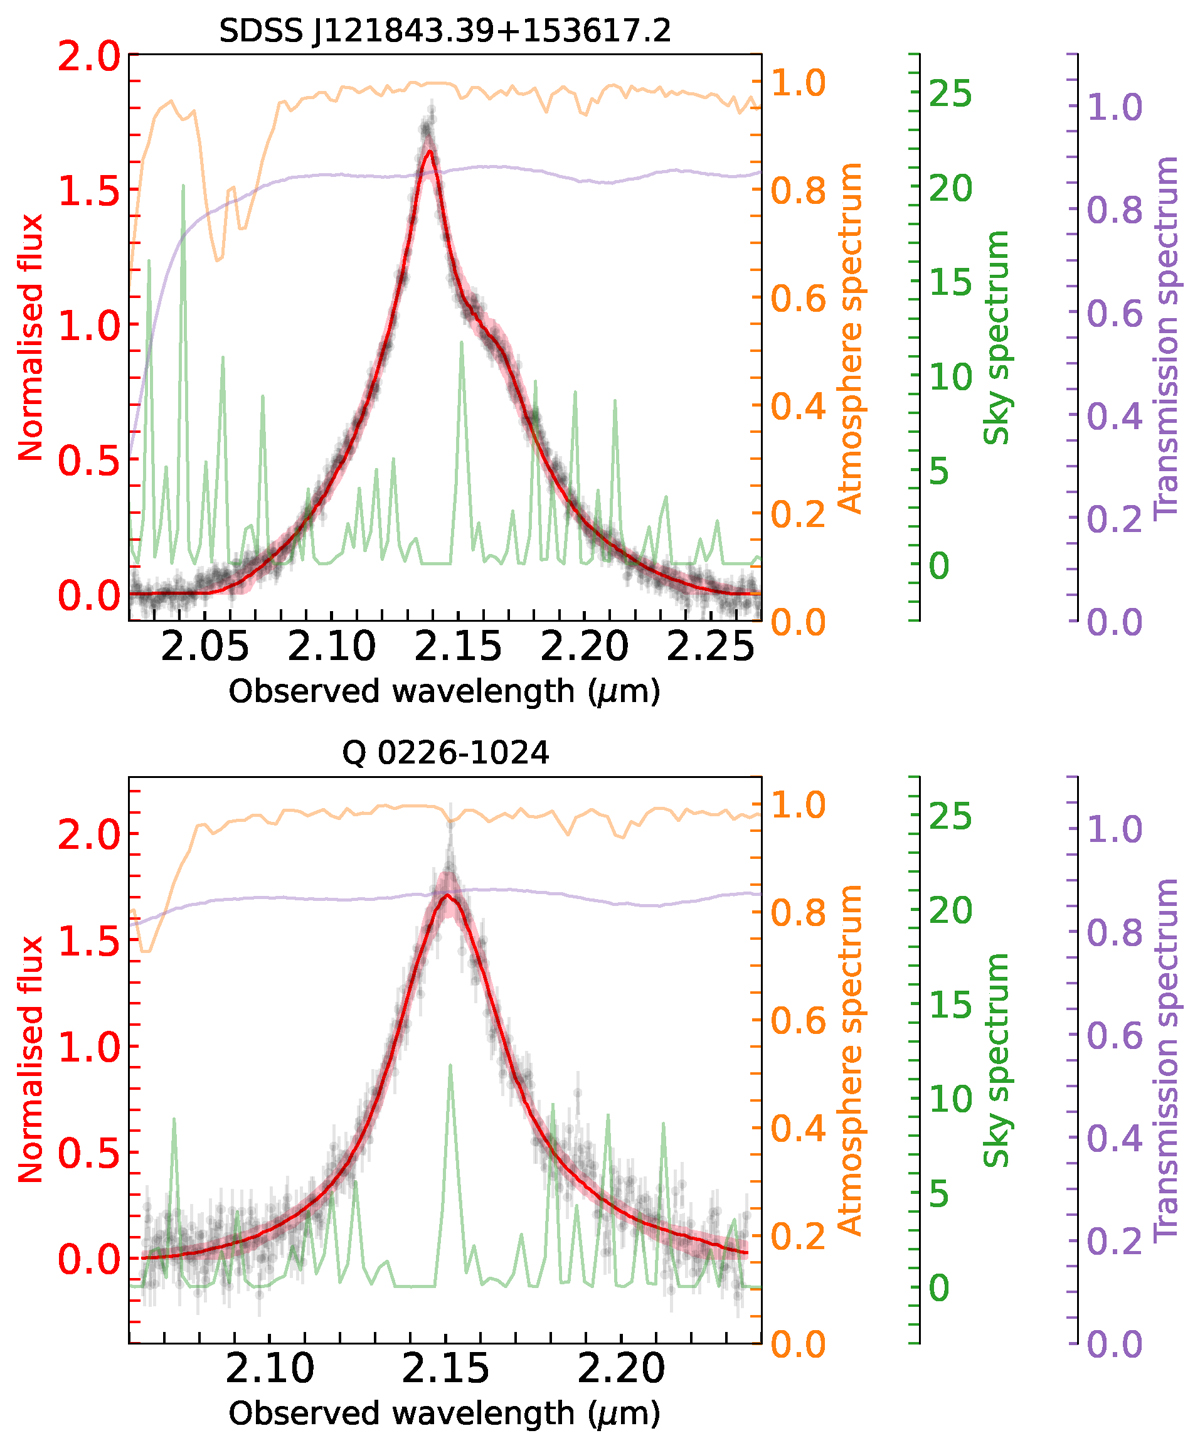
Fig. 7.
Download original image
Data (black points) and model (solid red line) Hα spectra derived from the best-fit BLR model of two SOFI z ∼ 2 targets fitted with the full model. The red-shaded regions show the 1σ error of the model spectra. The name of the target is shown on top of each panel. (a) Even after removing the bump on the right side of the Hα emission line, which we believe to be [N II] λ6584, SDSS J121843.39+153617.2 still shows an asymmetric Hα line profile which cannot be fitted with the circular model. (b) The Hα emission line of Q 0226–1024 shows an asymmetry in its wings which is better fitted with the full model. We also present the theoretical OH (sky) spectrum, the theoretical atmospheric profile, and the filter transmission profile of SOFI Ks band in orange, green, and purple lines, respectively. The sky and atmospheric profiles are normalised such that the maximum value is 1, and scaled by a factor of 2. We found that the observed asymmetries of both targets are within the high transmission regions of the SOFI Ks filter where no strong sky lines or atmospheric features are present.
Current usage metrics show cumulative count of Article Views (full-text article views including HTML views, PDF and ePub downloads, according to the available data) and Abstracts Views on Vision4Press platform.
Data correspond to usage on the plateform after 2015. The current usage metrics is available 48-96 hours after online publication and is updated daily on week days.
Initial download of the metrics may take a while.