Fig. 6.
Download original image
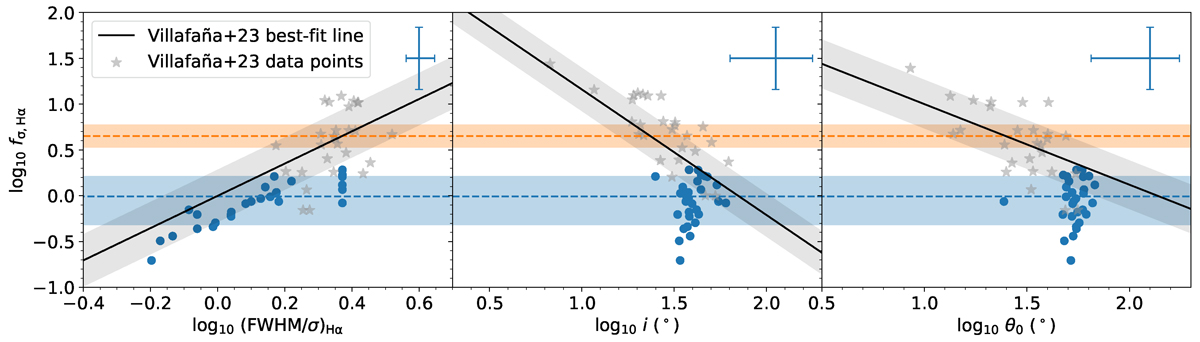
Virial factor fσ derived from the DyBEL BLR fitting using σ-derived SMBH masses, as a function of the Hα line shape (left panel), the inclination angle in degrees (middle panel), and the opening angle in degrees (right panel). The average 1σ uncertainties are shown on the upper right of each panel. The orange dashed horizontal line and its 1σ range refer to f = 4.47, the virial factor in the scaling relations of Woo et al. (2015) from which we derived the SMBH masses to use as input to the fitting procedure. The blue dashed horizontal line and its 1σ range refer to the average Hα virial factor from our modelling: ⟨fσ, Hα⟩=1.44. For comparison, we plot the data points from Villafaña et al. (2023) together with a black solid line and a grey region denoting the best-fit relation and its intrinsic scatter.
Current usage metrics show cumulative count of Article Views (full-text article views including HTML views, PDF and ePub downloads, according to the available data) and Abstracts Views on Vision4Press platform.
Data correspond to usage on the plateform after 2015. The current usage metrics is available 48-96 hours after online publication and is updated daily on week days.
Initial download of the metrics may take a while.