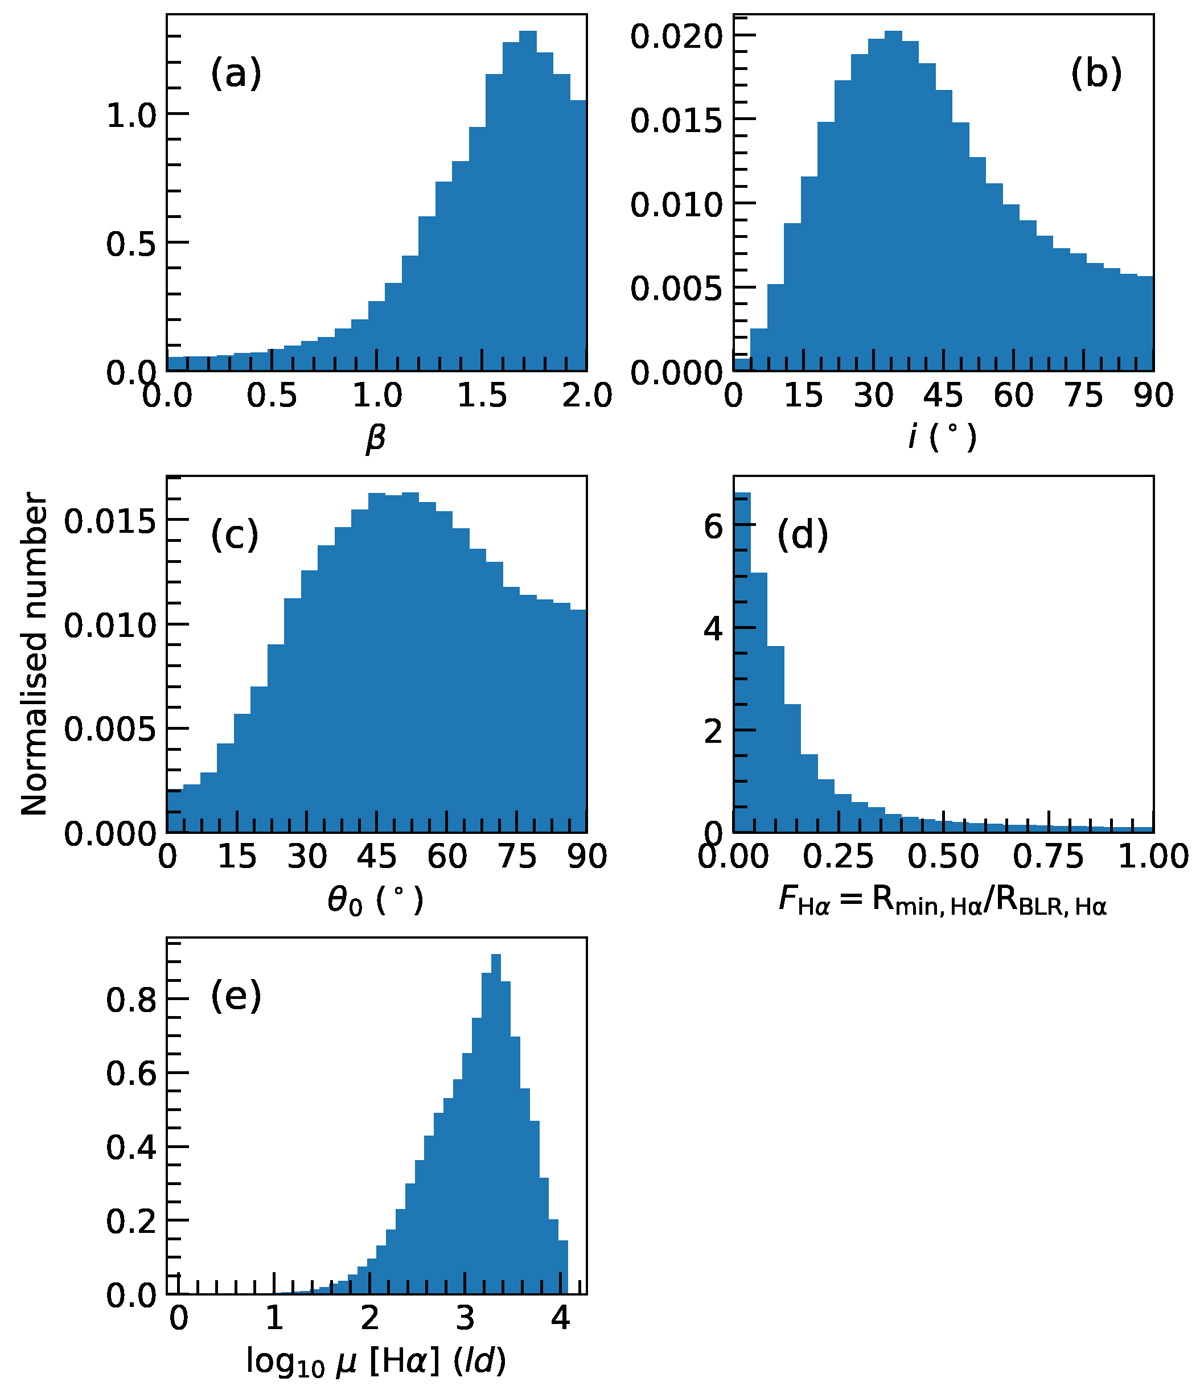
Fig. 5.
Download original image
Normalised (i.e. independently for each histogram such that the area under the histogram is 1) histograms showing in blue the summed posterior distributions of the BLR parameters from the best fits to all the z ∼ 2 targets. The panels correspond to (a) the radial distribution of BLR clouds, (b) the inclination angle, (c) the opening angle, with the minimum and maximum values defining the thin disc and spherical shape, respectively, (d) the ratio between the minimum and mean Hα BLR radius, and (e) the mean (emissivity) Hα BLR radius.
Current usage metrics show cumulative count of Article Views (full-text article views including HTML views, PDF and ePub downloads, according to the available data) and Abstracts Views on Vision4Press platform.
Data correspond to usage on the plateform after 2015. The current usage metrics is available 48-96 hours after online publication and is updated daily on week days.
Initial download of the metrics may take a while.