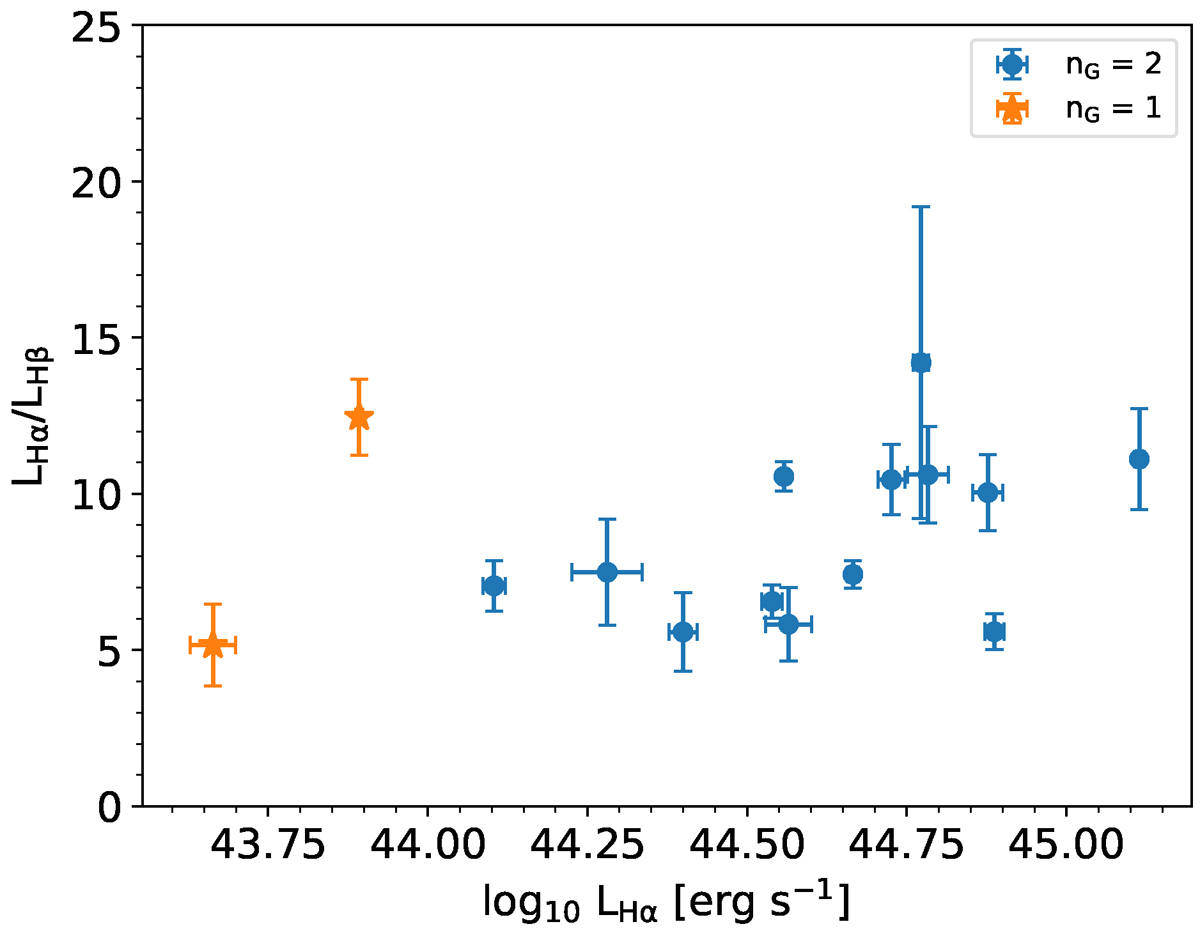
Fig. 3.
Download original image
Ratio between Hα and Hβ luminosity as a function of Hα luminosity. The blue (orange) points show the targets that are fitted with a double (single) Gaussian model. We remove two targets (from the three exceptions in Table A.4) whose Hβ lines cannot be fitted with the same number of Gaussian components and line shape as that of Hα. The error bars are 1σ uncertainties.
Current usage metrics show cumulative count of Article Views (full-text article views including HTML views, PDF and ePub downloads, according to the available data) and Abstracts Views on Vision4Press platform.
Data correspond to usage on the plateform after 2015. The current usage metrics is available 48-96 hours after online publication and is updated daily on week days.
Initial download of the metrics may take a while.