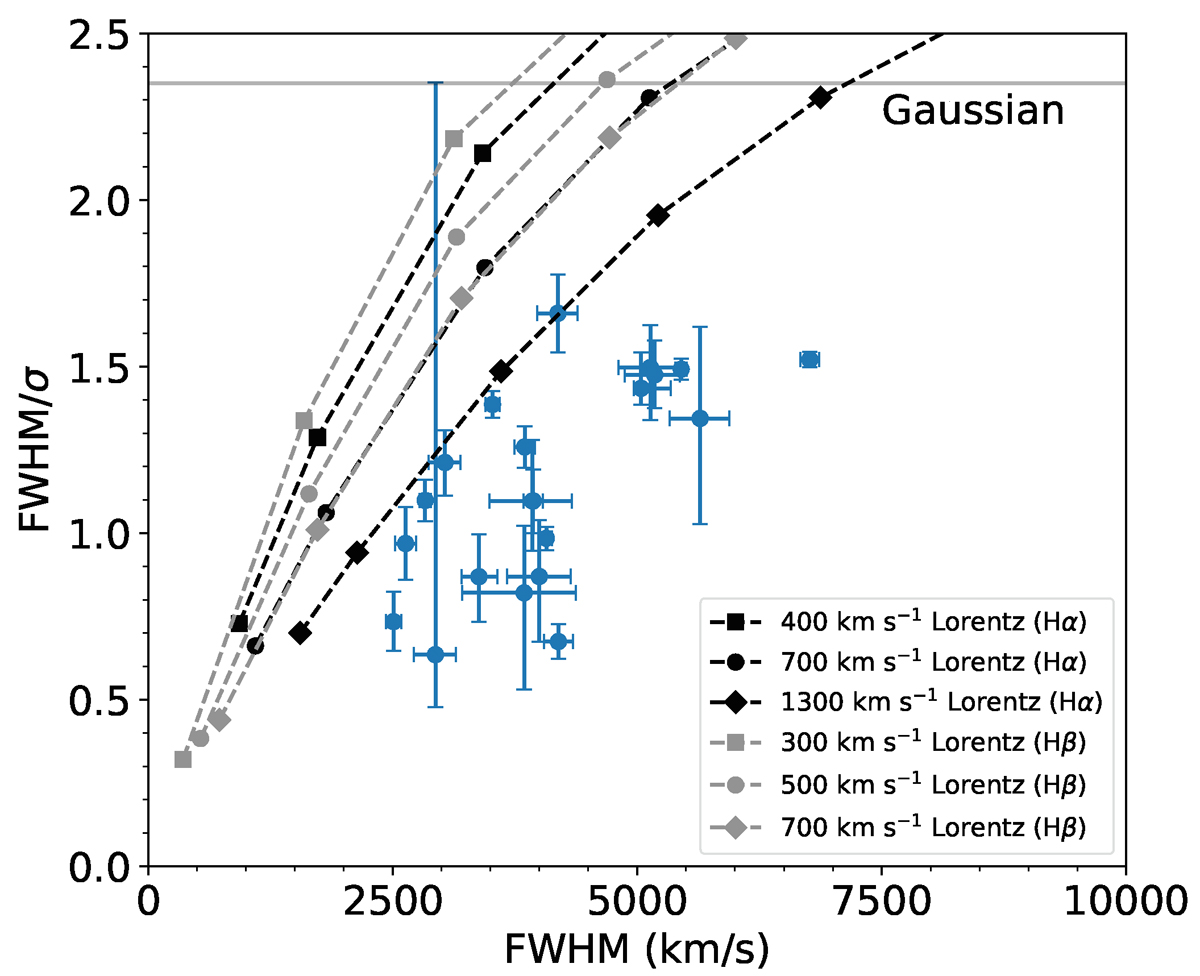
Fig. 2.
Download original image
Ratio of FWHM to σ (line shape) of Hα lines fitted with the double-Gaussian model as a function of FWHM. The Gaussian limit (FWHM ∼ 2.35σ) is shown as a horizontal grey solid line. The error bars denote 1σ uncertainties. For comparison, we plot the theoretical line width ratios of rotational line broadened Lorentzian profiles for Hα (black dashed lines and markers) and Hβ (grey dashed lines and markers) which were taken from Kollatschny & Zetzl (2011) and Kollatschny & Zetzl (2013). Different markers pertain to different FWHMs of the Lorentzian profiles.
Current usage metrics show cumulative count of Article Views (full-text article views including HTML views, PDF and ePub downloads, according to the available data) and Abstracts Views on Vision4Press platform.
Data correspond to usage on the plateform after 2015. The current usage metrics is available 48-96 hours after online publication and is updated daily on week days.
Initial download of the metrics may take a while.