Fig. 10.
Download original image
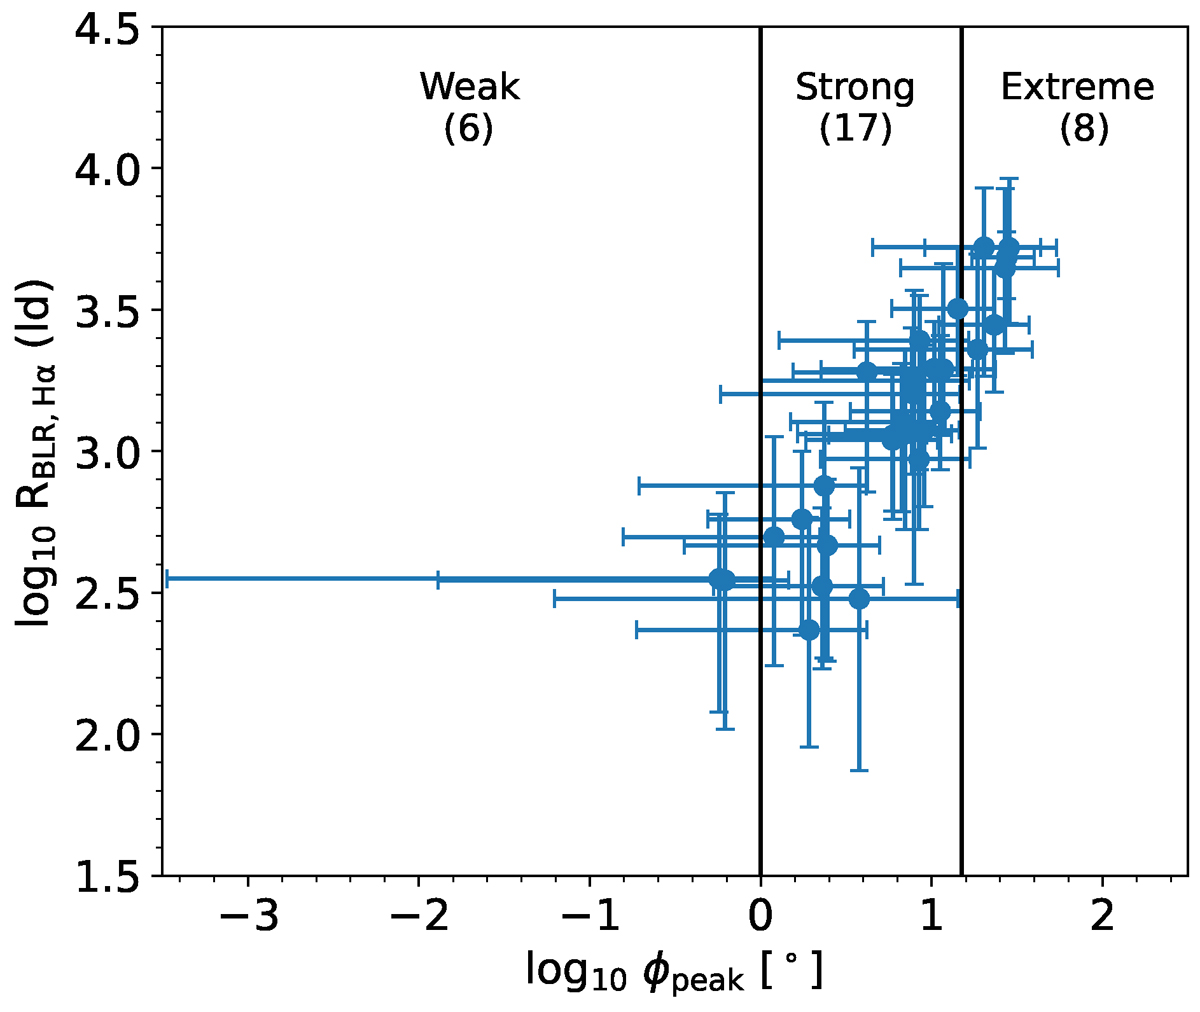
Hα BLR size as a function of the peak expected differential phase in logarithm. The error bars correspond to their 1σ errors. The solid vertical lines pertain to the divisions categorising the targets into weak, strong, and extreme targets (see discussion in Sect. 6.1). The number of targets for each category is shown in parentheses.
Current usage metrics show cumulative count of Article Views (full-text article views including HTML views, PDF and ePub downloads, according to the available data) and Abstracts Views on Vision4Press platform.
Data correspond to usage on the plateform after 2015. The current usage metrics is available 48-96 hours after online publication and is updated daily on week days.
Initial download of the metrics may take a while.