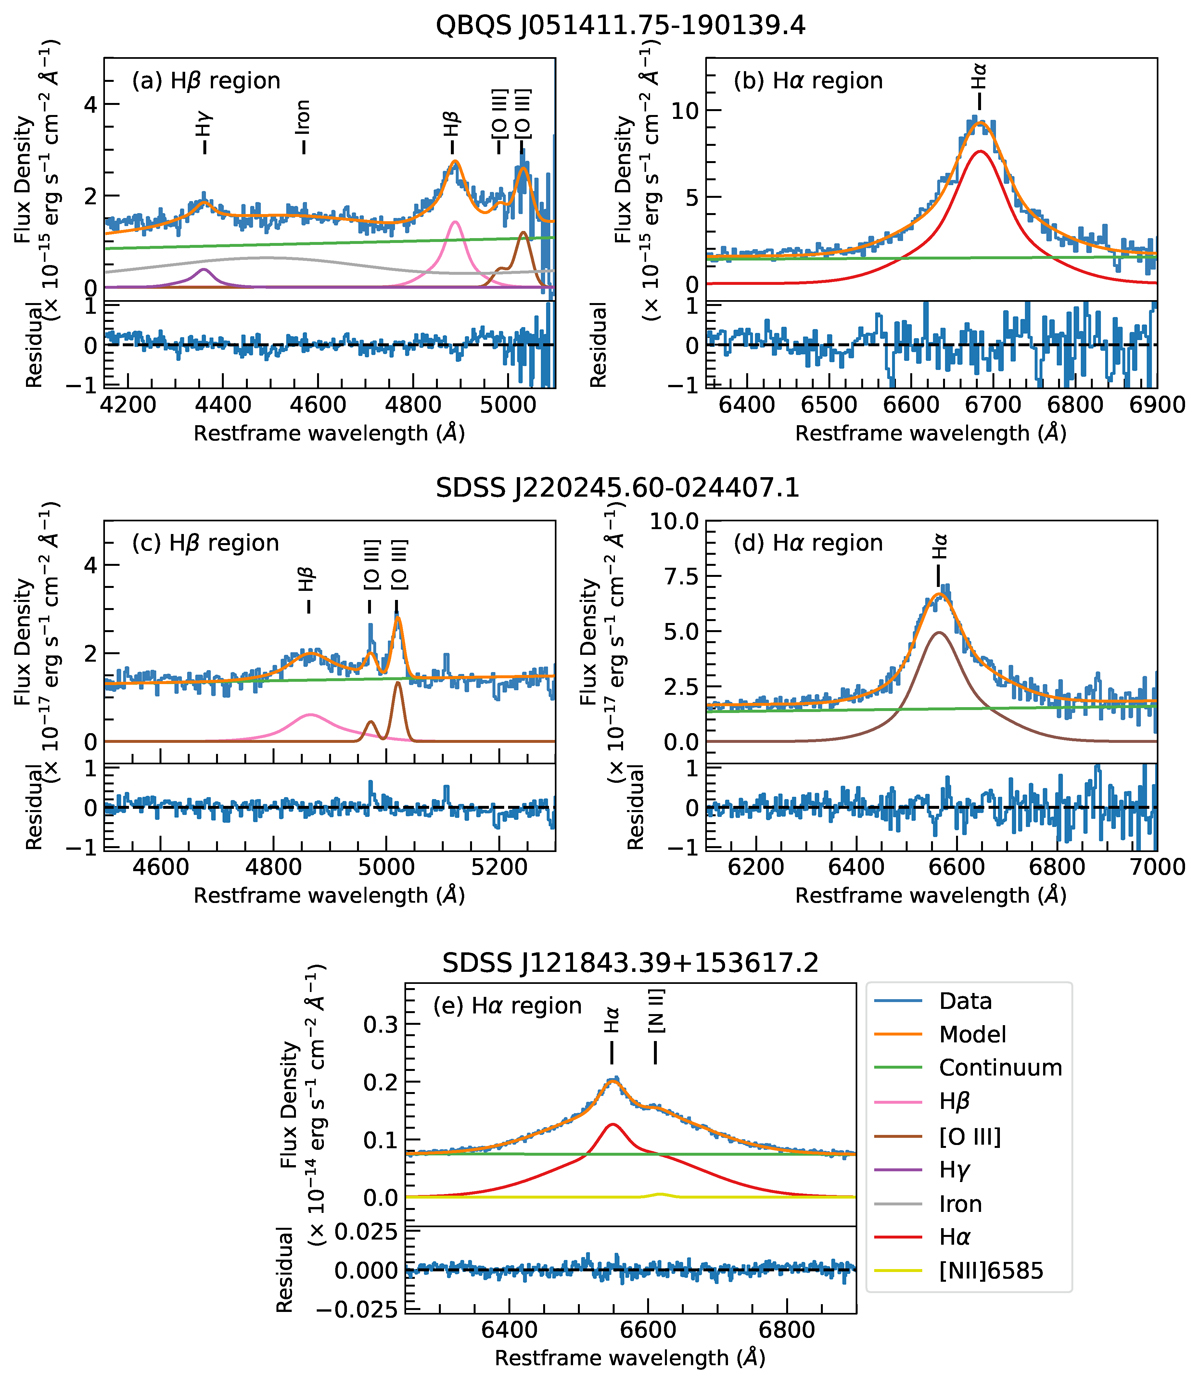
Fig. 1.

Download original image
Representative line decomposition results for three of our SOFI z ∼ 2 targets. Each row refers to a different target (QBQS J051411.75-190139.4, SDSS J220245.60-024407.1, and SDSS J121843.39+153617.2), while each column refers to a different spectral region (Hβ and Hα). The observed data are shown in blue, while the cumulative best-fit spectrum is shown as an orange solid line. The different coloured lines pertain to different components in the line decomposition, as shown in the legend. Some of our targets have strong Fe II and even clear Hγ emission, as shown in the Hβ region of QBQS J051411.75-190139.4 (panel a). On the other hand, a few targets have prominent (S/N > 3) [O III] features similar to SDSS J220245.60-024407.1 (panel c). Both of these objects were observed with the GRF filter, hence other Balmer lines aside from Hα are detected. On the other hand, SDSS J121843.39+153617.2 was observed with the Ks filter (panel e). Its Hα spectrum shows a weak [N II] λ6584 feature (see Sect. 4.2).
Current usage metrics show cumulative count of Article Views (full-text article views including HTML views, PDF and ePub downloads, according to the available data) and Abstracts Views on Vision4Press platform.
Data correspond to usage on the plateform after 2015. The current usage metrics is available 48-96 hours after online publication and is updated daily on week days.
Initial download of the metrics may take a while.


