Open Access
Fig. 9
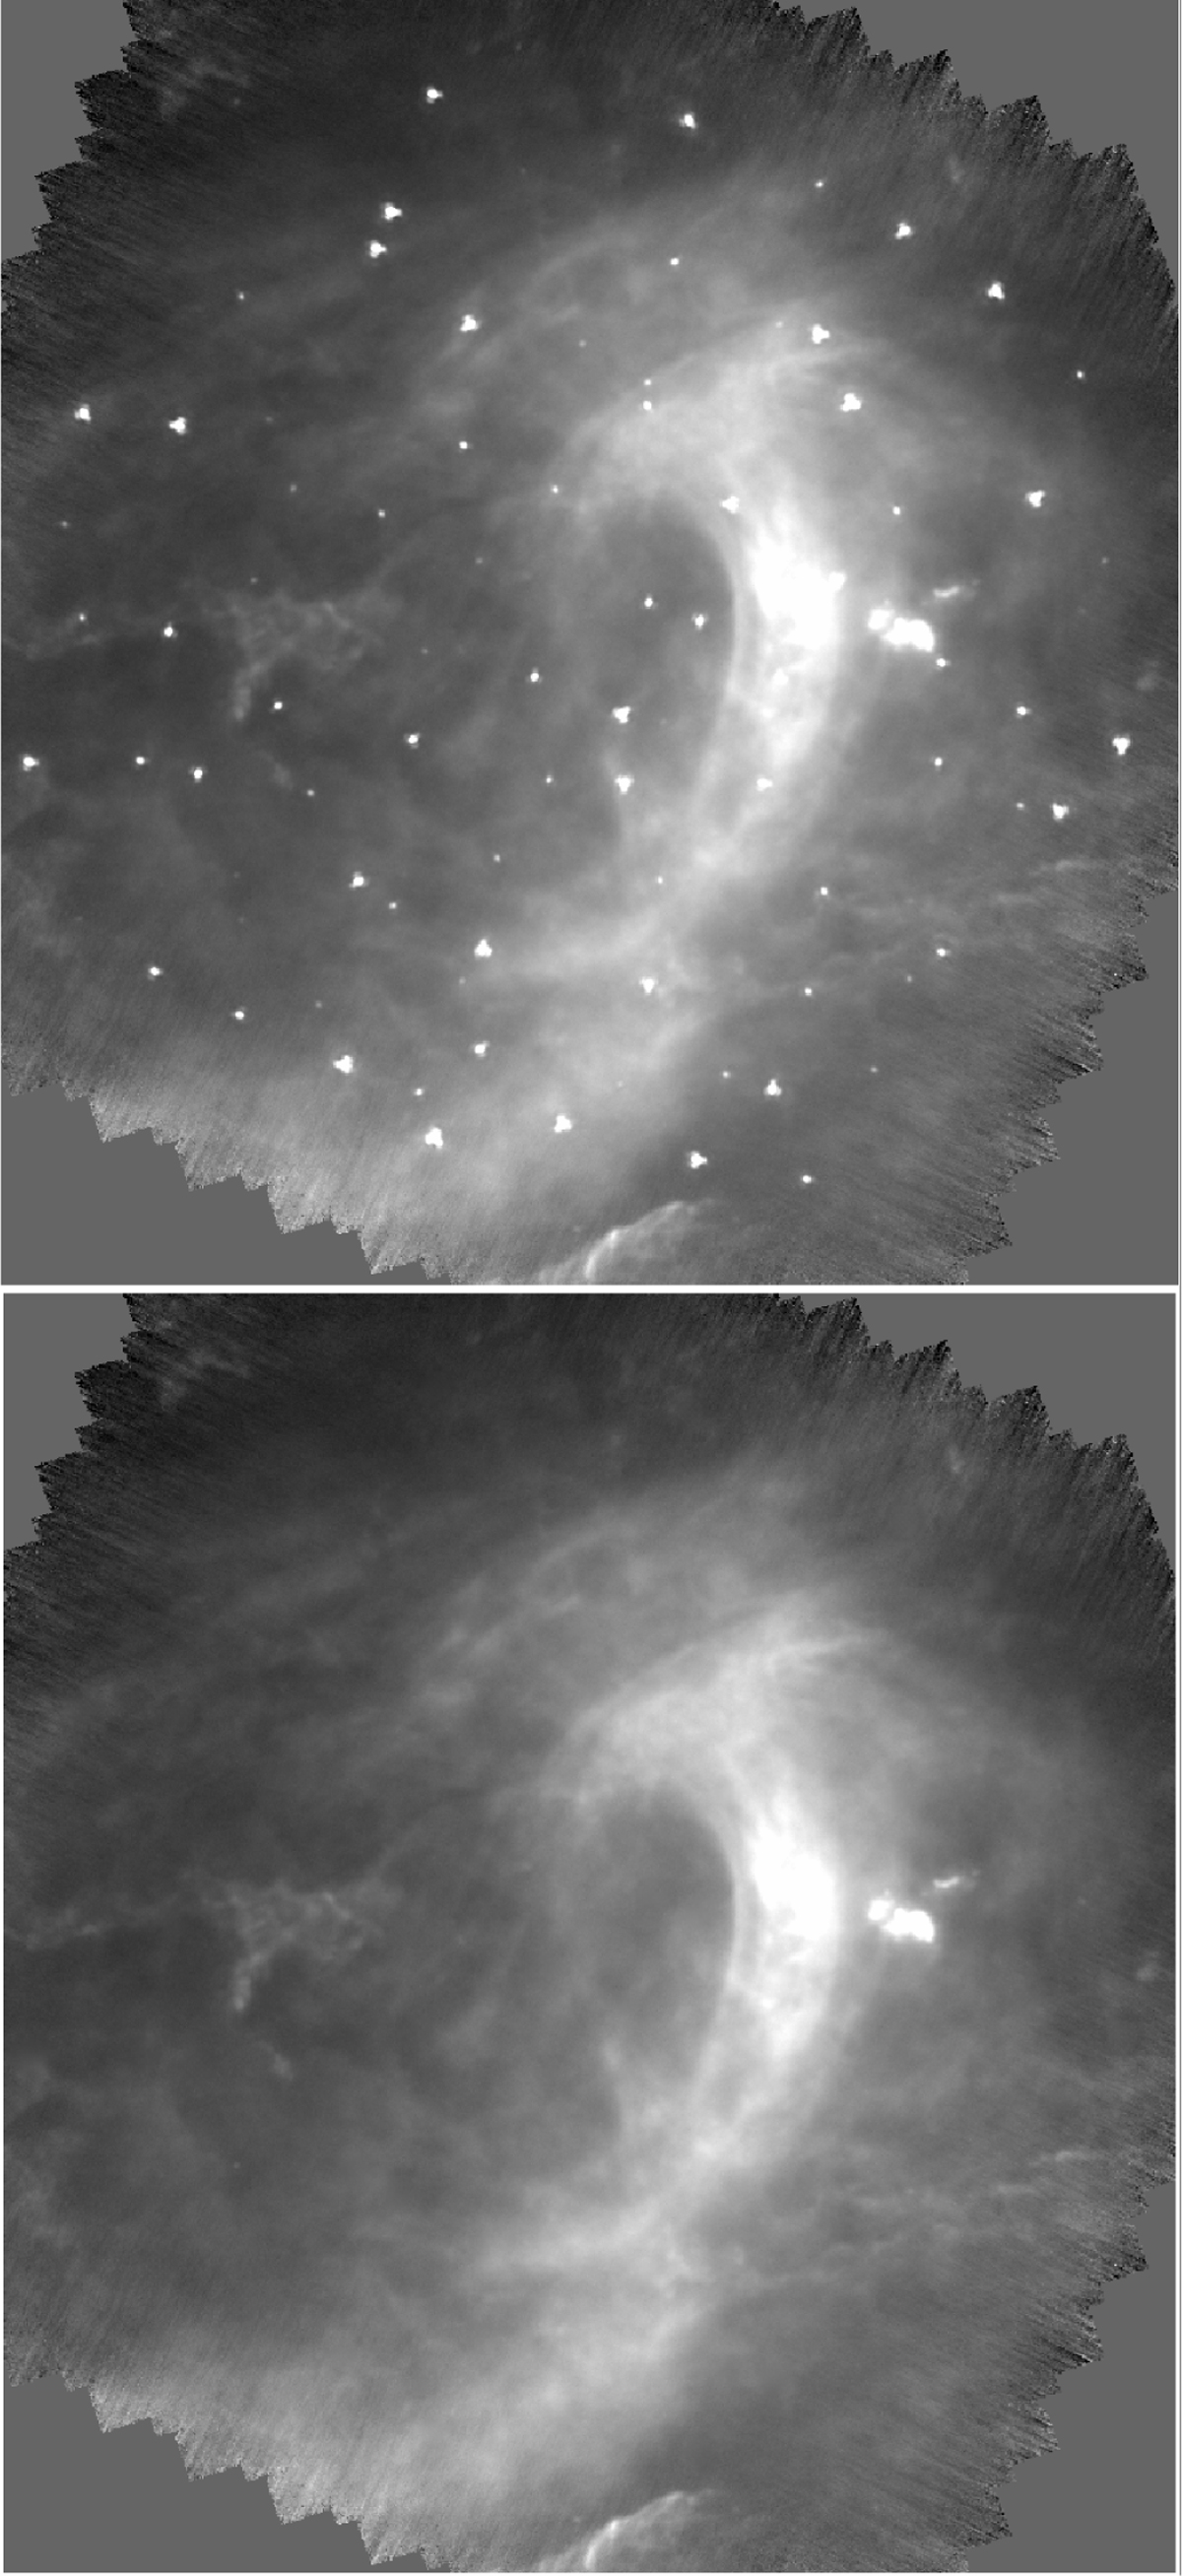
Download original image
Example of simulated source removal. Top: Simulated image with 90 injected sources (randomly chosen flux densities from 40 to 10 000 mJy) within the scan map blue observation data (oid=1342237154). Bottom: Model output with sources removed, providing a source-free background image.
Current usage metrics show cumulative count of Article Views (full-text article views including HTML views, PDF and ePub downloads, according to the available data) and Abstracts Views on Vision4Press platform.
Data correspond to usage on the plateform after 2015. The current usage metrics is available 48-96 hours after online publication and is updated daily on week days.
Initial download of the metrics may take a while.