Fig. 8
Download original image
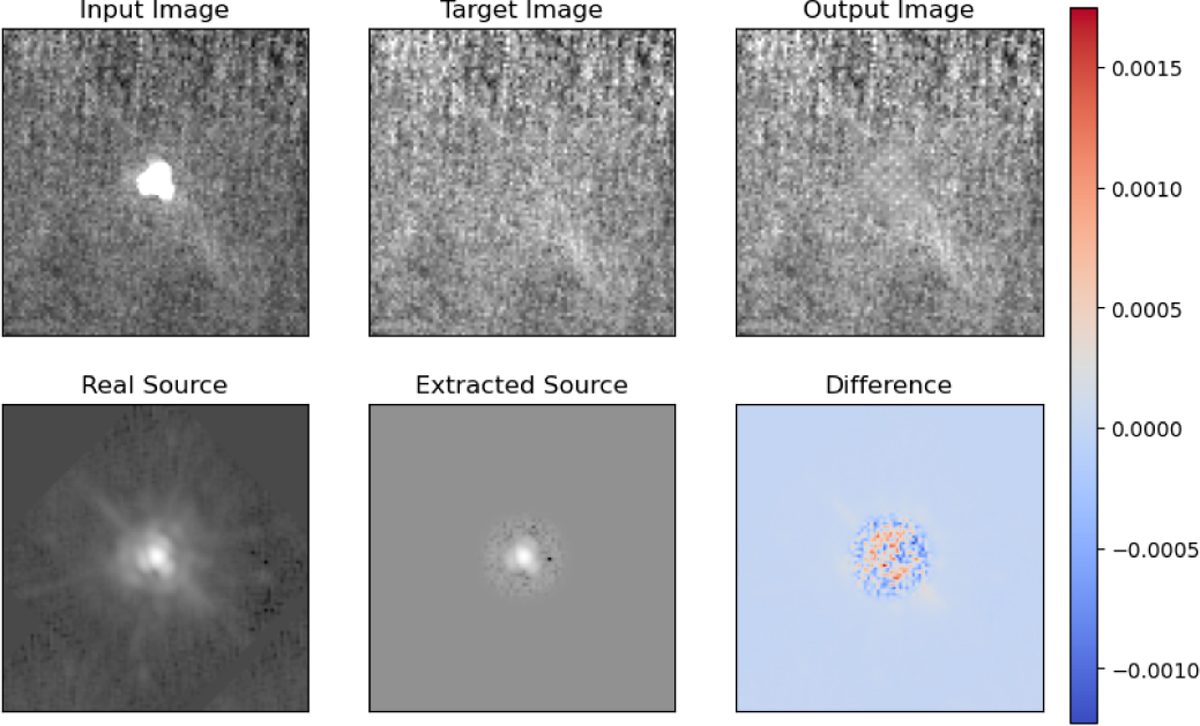
Visualization of the source loss. The top row displays the input image, the ground truth target (source-less image), and the output prediction (during the training process), respectively. The bottom row illustrates the real source (difference between the original image and the ground truth sourceless image), extracted source (difference between the original image and the predicted source-free image), and the difference between these two sources.
Current usage metrics show cumulative count of Article Views (full-text article views including HTML views, PDF and ePub downloads, according to the available data) and Abstracts Views on Vision4Press platform.
Data correspond to usage on the plateform after 2015. The current usage metrics is available 48-96 hours after online publication and is updated daily on week days.
Initial download of the metrics may take a while.