Fig. 5
Download original image
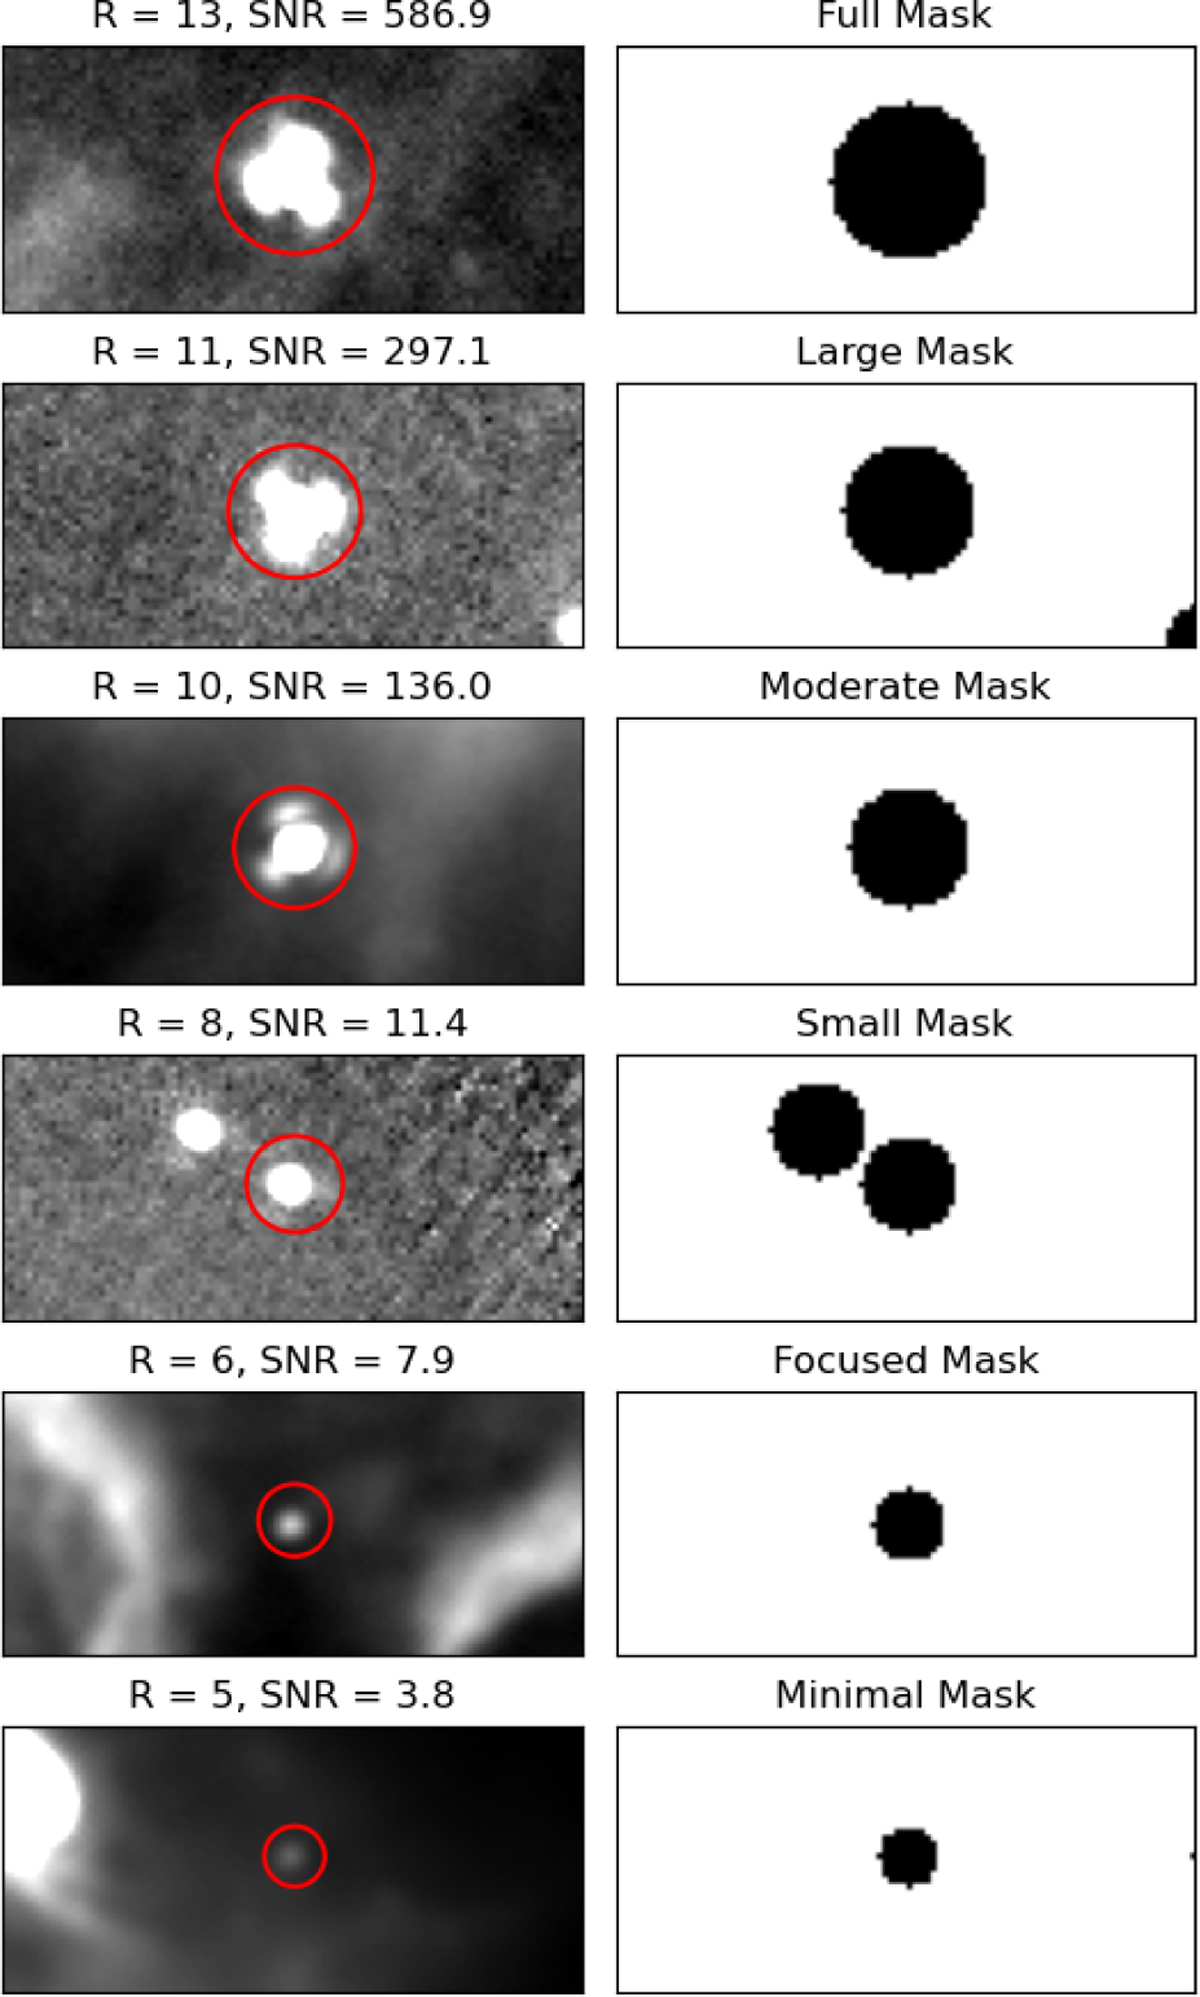
Examples of the six different mask sizes used in the scan map blue dataset. For each example, the left column shows the cutout image with the target object centered, along with the corresponding mask radius and the S/N value of the central object. The right column displays the binary mask used for inpainting. Note that multiple objects may appear within a cutout, but the S/N value and mask radius are determined based on the source located at the center of the image.
Current usage metrics show cumulative count of Article Views (full-text article views including HTML views, PDF and ePub downloads, according to the available data) and Abstracts Views on Vision4Press platform.
Data correspond to usage on the plateform after 2015. The current usage metrics is available 48-96 hours after online publication and is updated daily on week days.
Initial download of the metrics may take a while.