Open Access
Fig. 4
Download original image
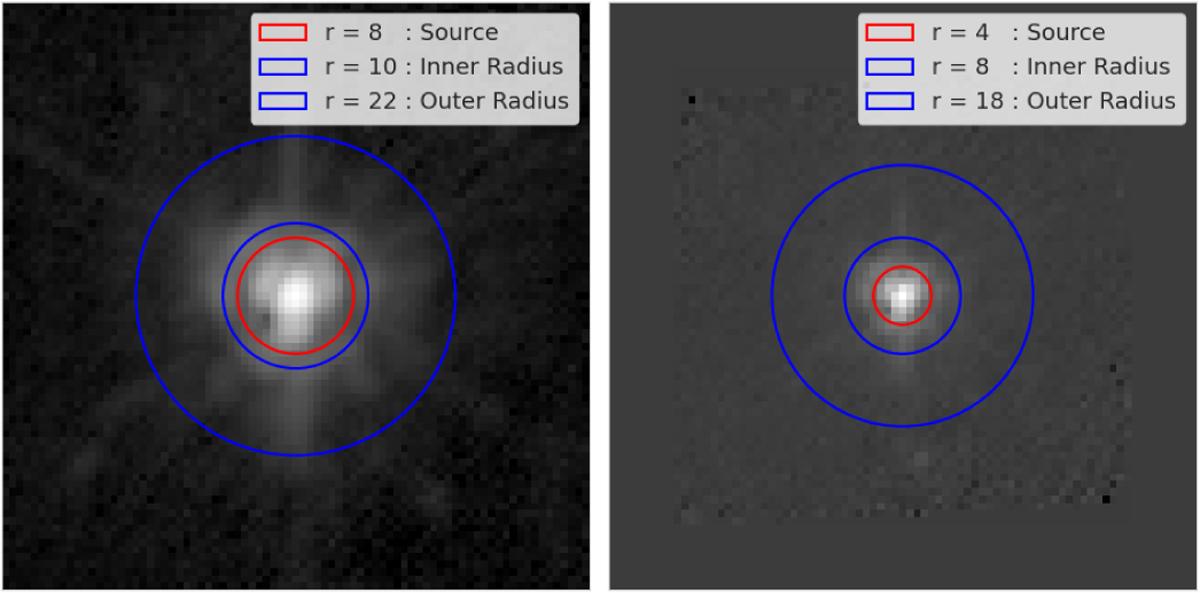
Illustration of the S/N calculation. Red and blue circles indicate the source region and the surrounding annulus, respectively. The left panel shows the scan map blue PSF on a logarithmic scale, while the right panel shows the parallel blue PSF on a logarithmic scale.
Current usage metrics show cumulative count of Article Views (full-text article views including HTML views, PDF and ePub downloads, according to the available data) and Abstracts Views on Vision4Press platform.
Data correspond to usage on the plateform after 2015. The current usage metrics is available 48-96 hours after online publication and is updated daily on week days.
Initial download of the metrics may take a while.