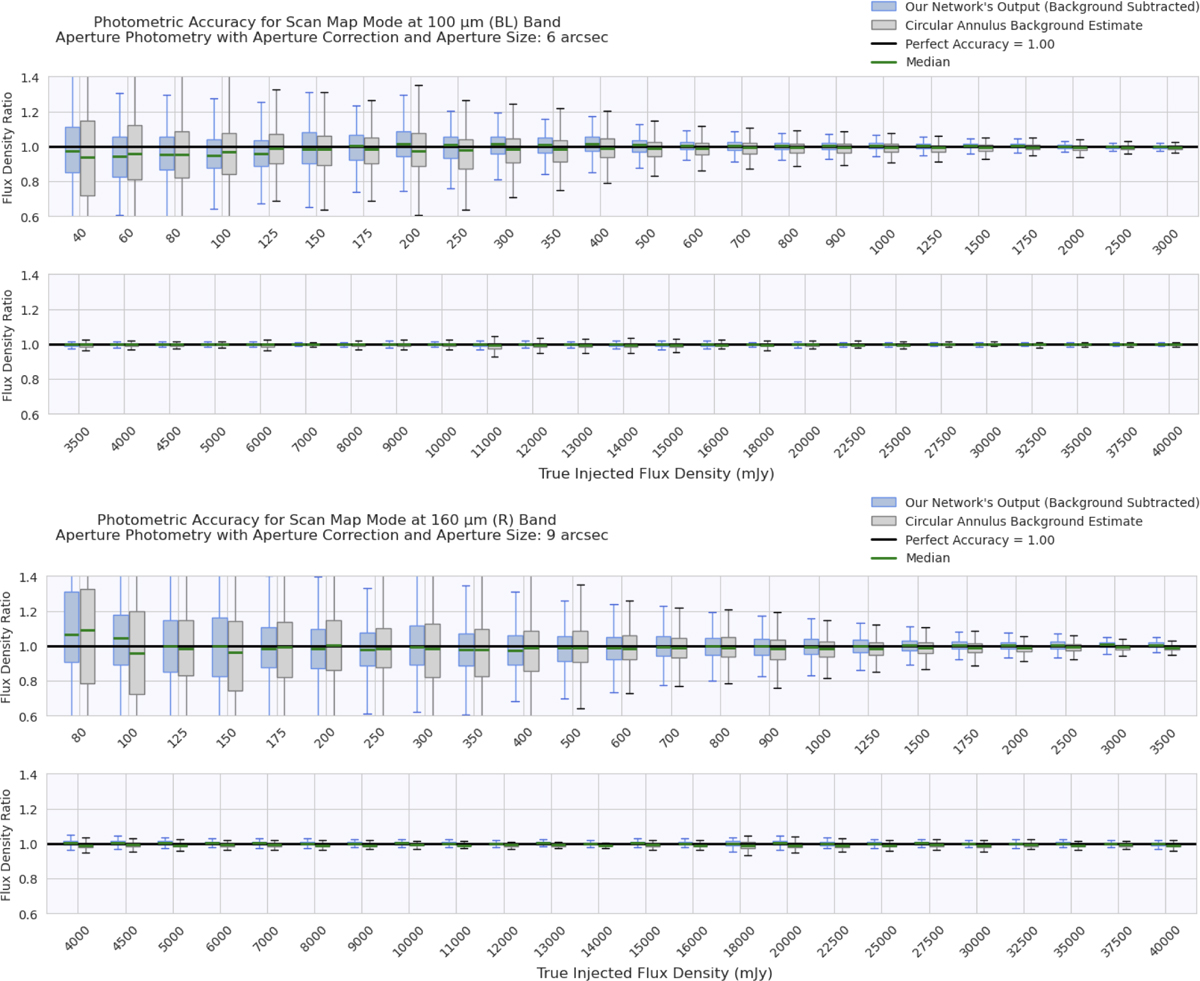
Fig. A.1
Download original image
Photometric accuracy evaluation for the scan map green and red bands. Top: scan map green (100 µm); Bottom: scan map red (160 µm). Blue boxes represent the flux density ratios of sources extracted by our model to the known injected fluxes, while gray boxes show ratios using baseline estimation without source removal. The line at y = 1 indicates perfect flux matching.
Current usage metrics show cumulative count of Article Views (full-text article views including HTML views, PDF and ePub downloads, according to the available data) and Abstracts Views on Vision4Press platform.
Data correspond to usage on the plateform after 2015. The current usage metrics is available 48-96 hours after online publication and is updated daily on week days.
Initial download of the metrics may take a while.