Fig. 12
Download original image
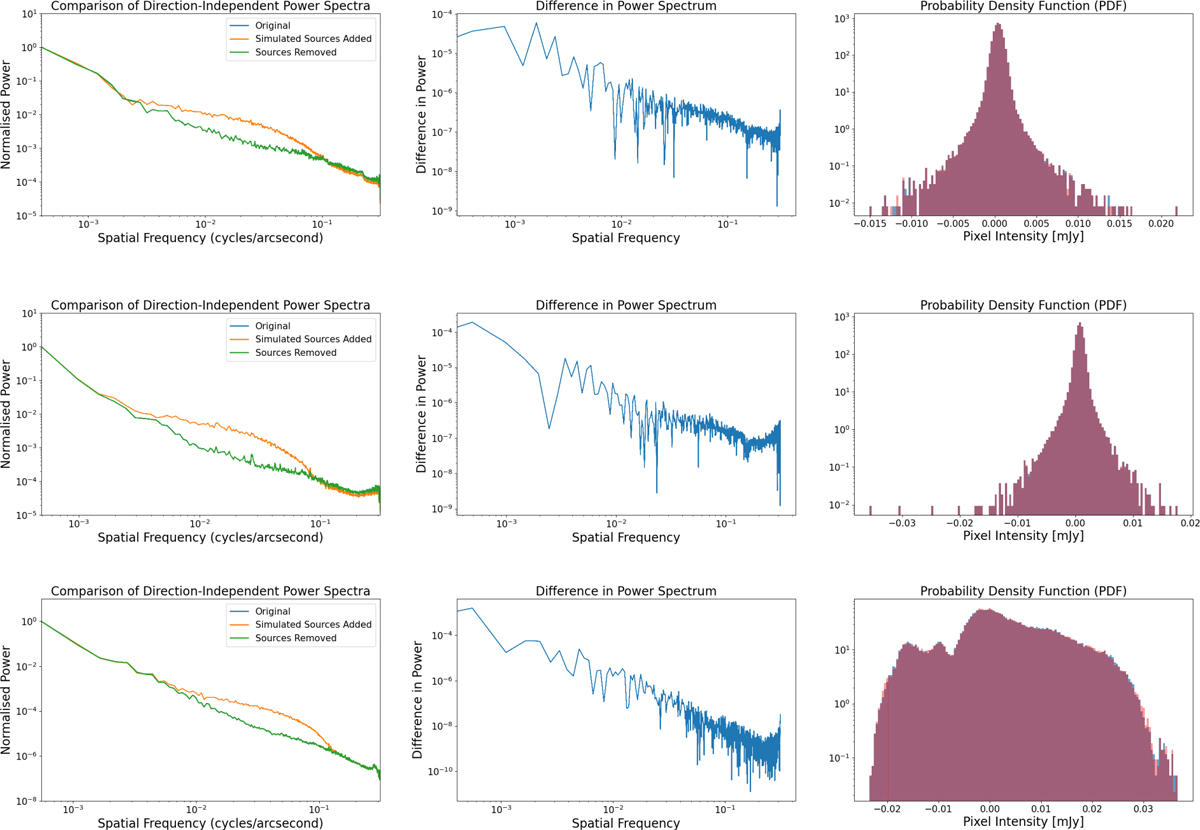
Power-spectrum analysis of test fields. From top to bottom, the three rows correspond to the scan map blue, green, and red fields, with observation IDs 1342216409, 1342244224, 1342249136, respectively. Left column: direction independent Fourier transform power spectra of each field before adding artificial sources (blue line), with the artificial sources (orange) and after their removal (green). Power spectra are normalized. Middle column: difference of the power spectrum before adding sources and after their removal for each field. Right column: probability density functions before adding artificial sources (blue histograms) and after their removal (red histograms).
Current usage metrics show cumulative count of Article Views (full-text article views including HTML views, PDF and ePub downloads, according to the available data) and Abstracts Views on Vision4Press platform.
Data correspond to usage on the plateform after 2015. The current usage metrics is available 48-96 hours after online publication and is updated daily on week days.
Initial download of the metrics may take a while.