Fig. 1
Download original image
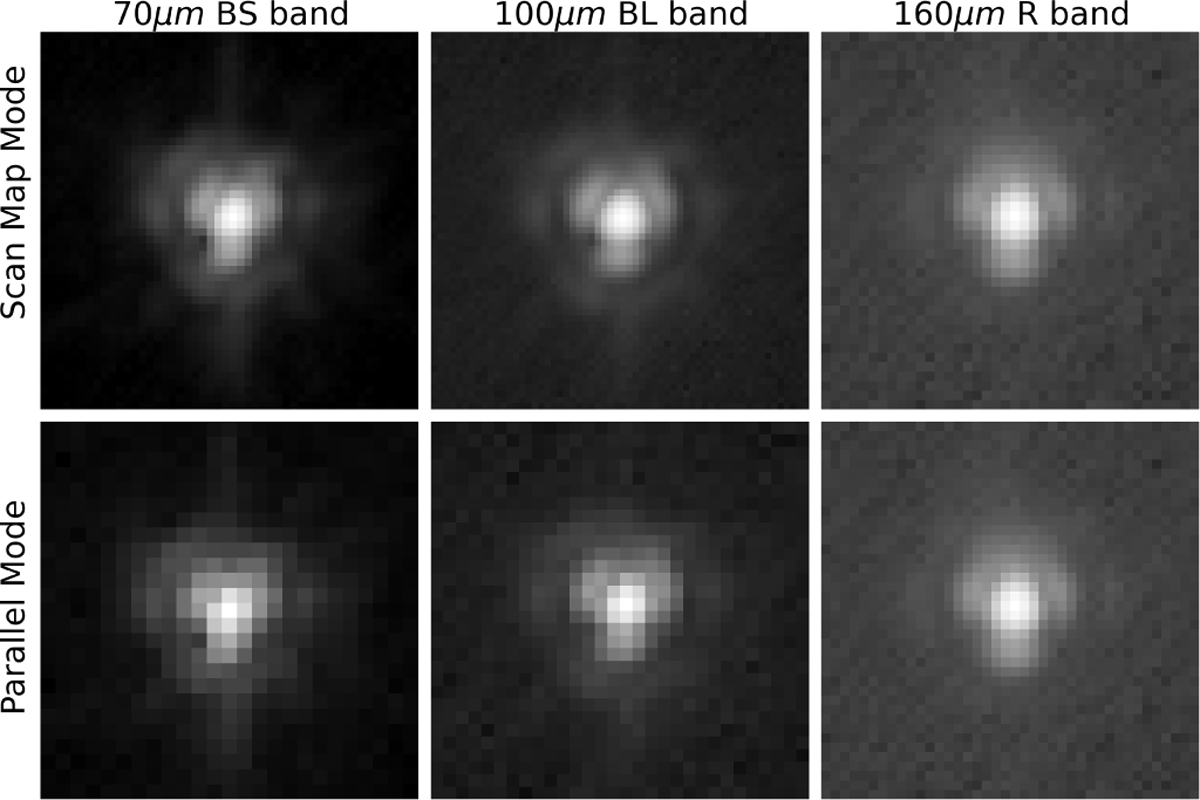
Vesta PSF images transformed to match observation image resolution. The first row represents the scan map mode, the second is the parallel mode, and the three columns correspond to the blue, green and red bands, respectively. Note that all the images were plotted to have the same size for visualization purposes, but it can be seen that the resolution of the PSF images differs between the bands and observing modes.
Current usage metrics show cumulative count of Article Views (full-text article views including HTML views, PDF and ePub downloads, according to the available data) and Abstracts Views on Vision4Press platform.
Data correspond to usage on the plateform after 2015. The current usage metrics is available 48-96 hours after online publication and is updated daily on week days.
Initial download of the metrics may take a while.