Fig. B.1
Download original image
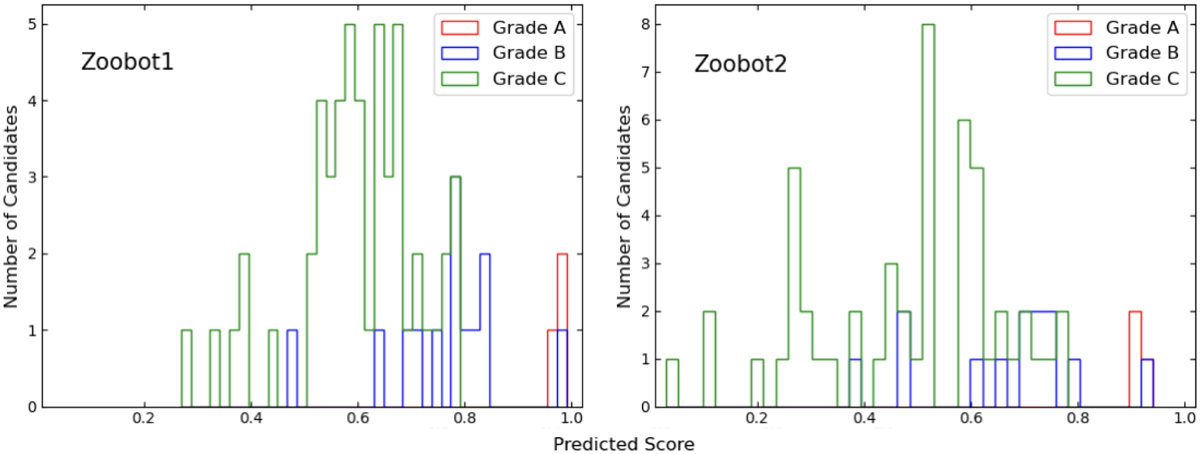
Distribution of predicted scores by Zoobot1 (left) and Zoobot2 (right) for lens candidates across all grades. Grade A lens candidates are confidently identified by both networks, shown to the right of the distribution in red at a high value of pLENS. Grade B predicted scores are shown in blue and are more varied for Zoobot2. The predicted scores for grade C lens candidates have the most variation amongst grades, shown in green, for both networks illustrating that Zoobot1 and Zoobot2 are not as confident in identifying grade C lens candidates.
Current usage metrics show cumulative count of Article Views (full-text article views including HTML views, PDF and ePub downloads, according to the available data) and Abstracts Views on Vision4Press platform.
Data correspond to usage on the plateform after 2015. The current usage metrics is available 48-96 hours after online publication and is updated daily on week days.
Initial download of the metrics may take a while.