Fig. A.1
Download original image
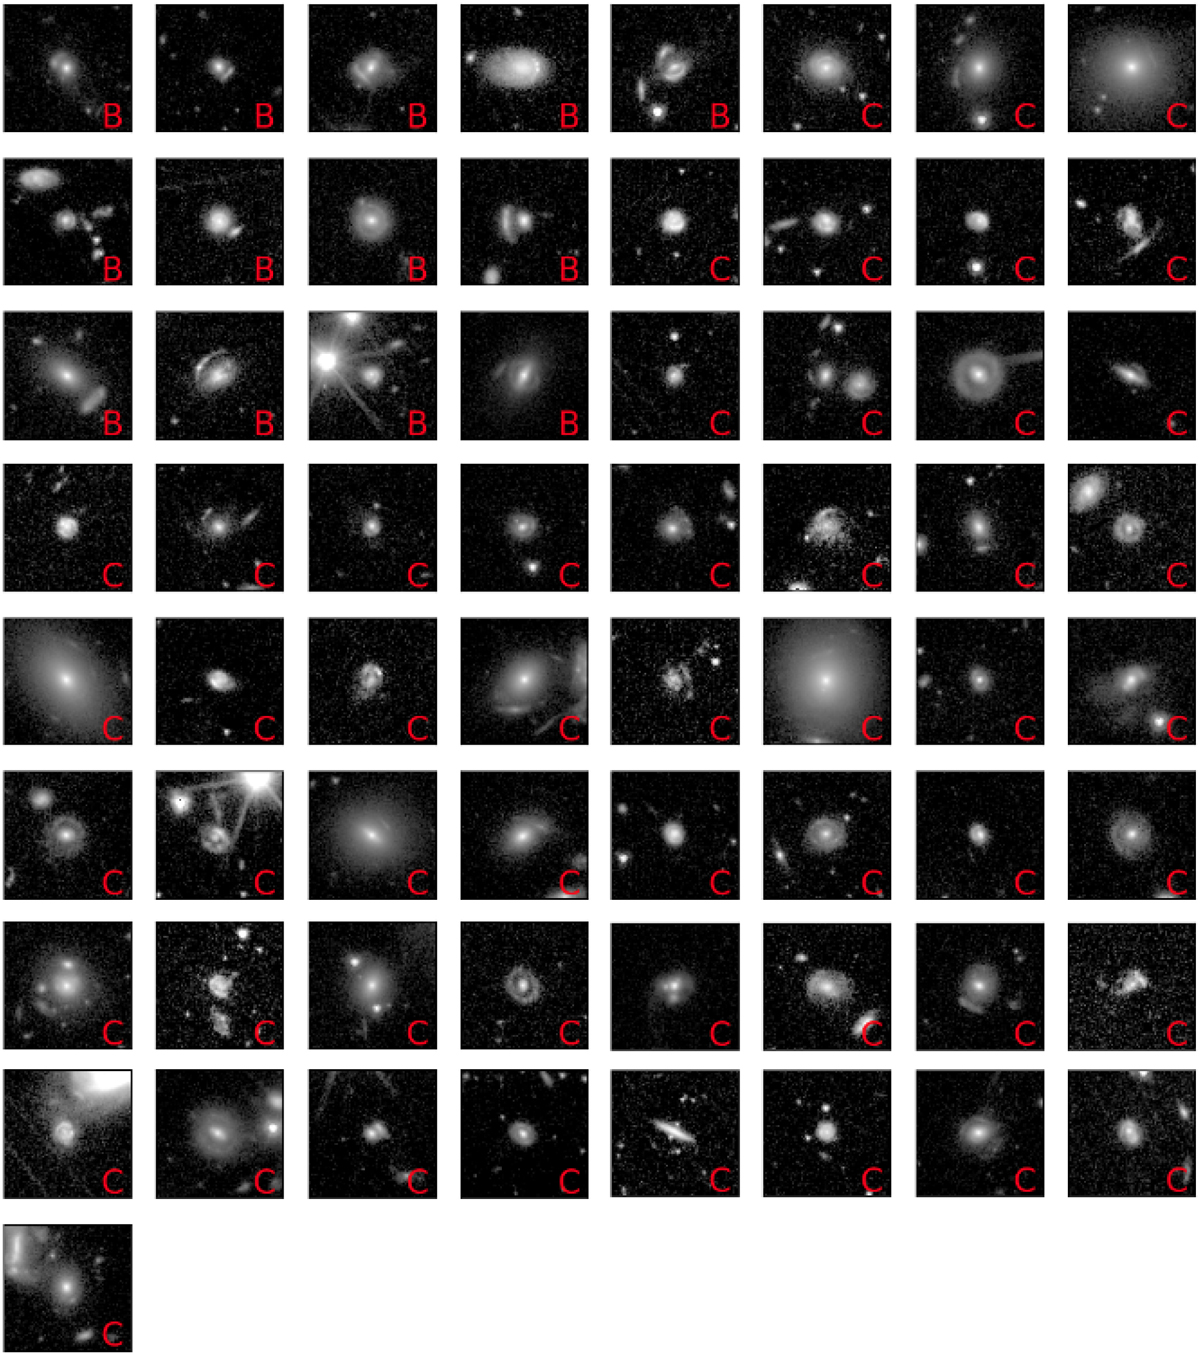
65 potential lens candidates considered as true positives in the common test data set in this work. The three grade A candidates are shown in Fig. 1 in the main text. 13 grade B and 52 grade C lens candidates are shown above with the respective grades shown in red in the bottom left corner of each subplot. Each image is 10′′ × 10′′.
Current usage metrics show cumulative count of Article Views (full-text article views including HTML views, PDF and ePub downloads, according to the available data) and Abstracts Views on Vision4Press platform.
Data correspond to usage on the plateform after 2015. The current usage metrics is available 48-96 hours after online publication and is updated daily on week days.
Initial download of the metrics may take a while.