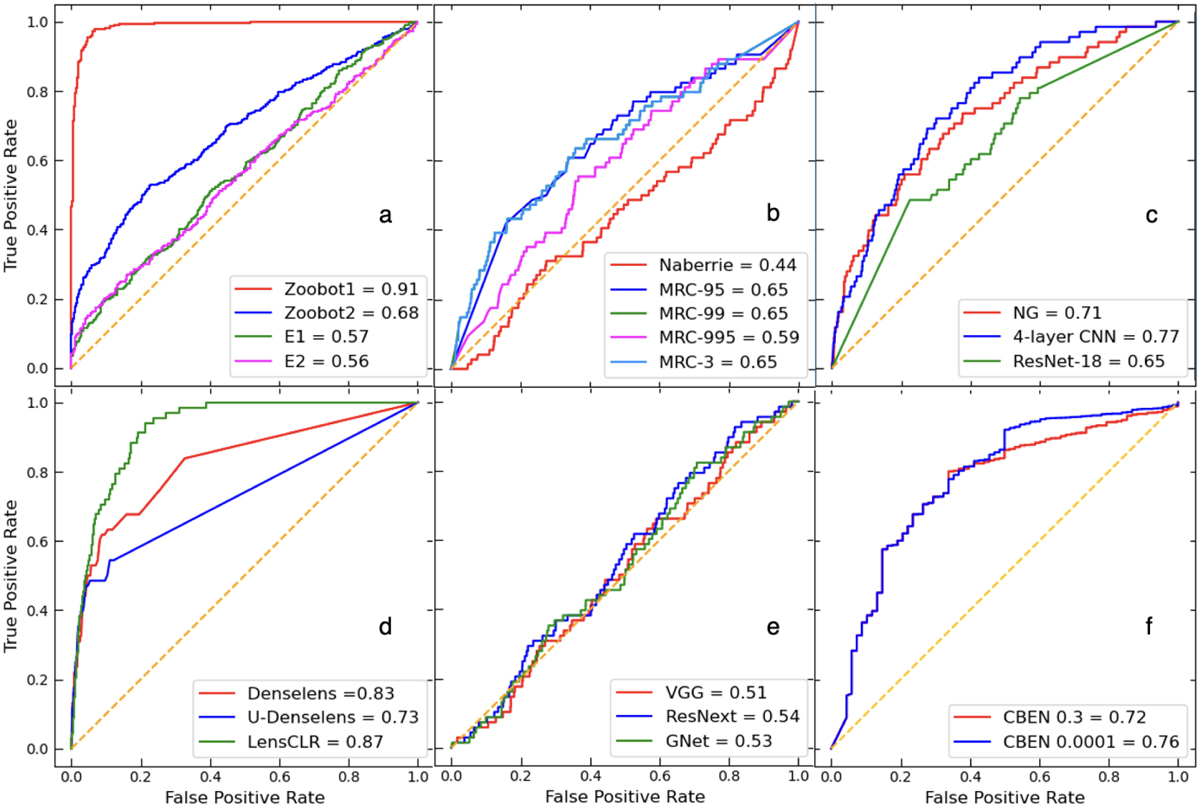
Fig. 4
Download original image
ROC curves for the networks described in Section 3. Performance of the Zoobot networks are shown in panel (a), Naberrie and MRC networks are shown in (b), NG, 4-layer CNN, and ResNet-18 are shown in (c), and Denselens and LencCLR are shown in (d). The performance of the networks described in Sect. 3.7 are shown in (e), and (f) shows the CBEN networks at two voting values β = 0.3 and β = 0.0001, respectively. The orange diagonal line marked represents the expected performance of an entirely random classifier. The values in the legend of each subplot represent the true positive recovery for each network. Higher performance is represented in general by curves approaching the top-left corner of the plots.
Current usage metrics show cumulative count of Article Views (full-text article views including HTML views, PDF and ePub downloads, according to the available data) and Abstracts Views on Vision4Press platform.
Data correspond to usage on the plateform after 2015. The current usage metrics is available 48-96 hours after online publication and is updated daily on week days.
Initial download of the metrics may take a while.