Fig. C.3
Download original image
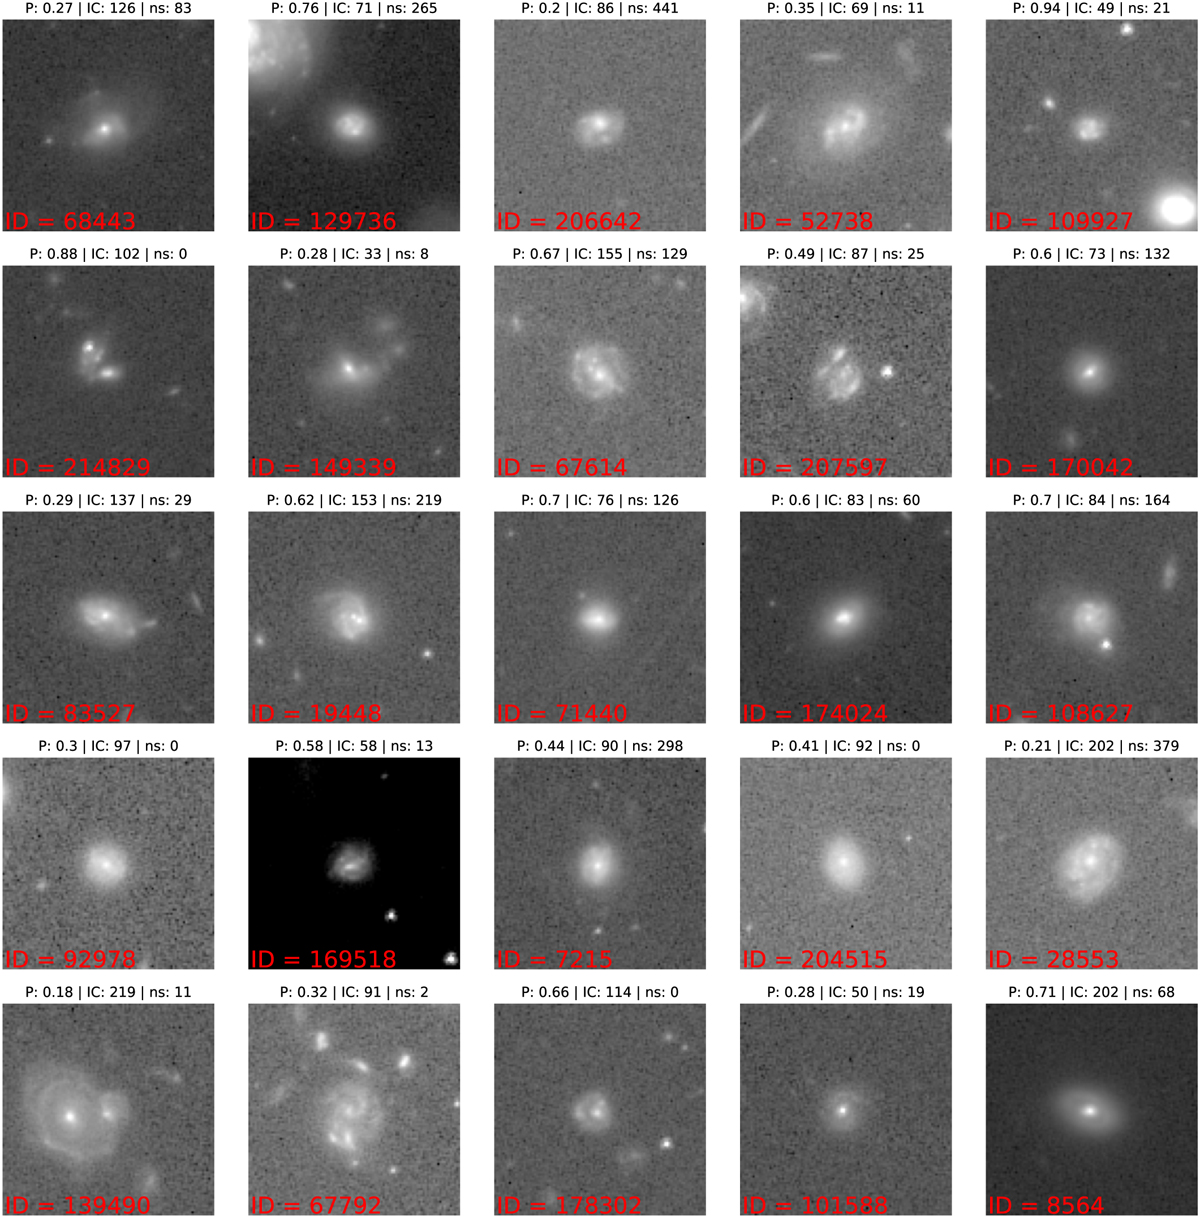
Example of 25 out of the 331 false positives (NFP in Table 1) found by the U-Denselens with the selection criteria in the common test set. Each panel contains the predicted score, pLENS, for each false positive along with the IC and ns. The ID of each source in shown in red in the bottom right. Frequently occurring morphologies are in agreement with other networks used in this work. Each IE-band image is 10′′ × 10′′.
Current usage metrics show cumulative count of Article Views (full-text article views including HTML views, PDF and ePub downloads, according to the available data) and Abstracts Views on Vision4Press platform.
Data correspond to usage on the plateform after 2015. The current usage metrics is available 48-96 hours after online publication and is updated daily on week days.
Initial download of the metrics may take a while.