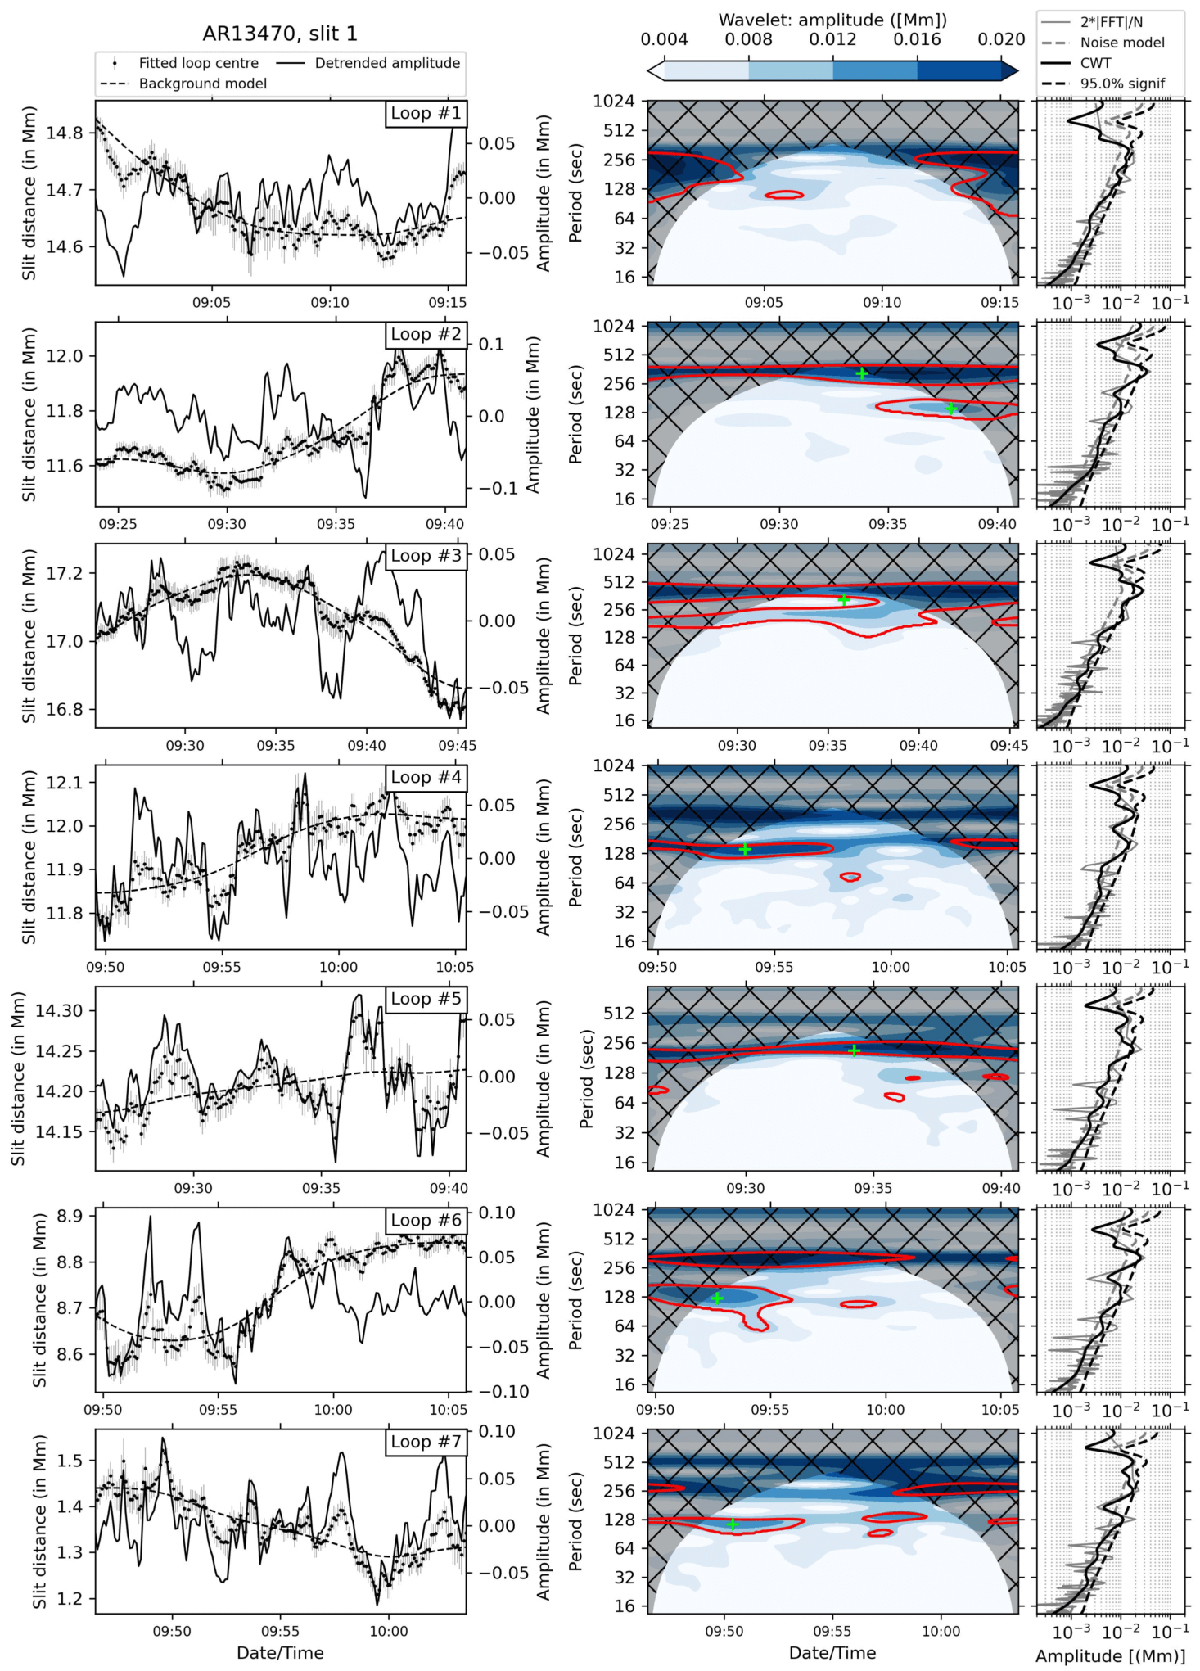
Fig. 9.
Download original image
Coronal oscillation analysis for the plage – enhanced-network coronal loops fitted in slit 1 of AR13470. First column: Time series for the loop fitted centres (dots) including uncertainties (light grey vertical bars) and background profile (dashed line) on the left y-axis, and final detrended oscillation amplitudes on the right y-axis (solid line). Second column: Wavelet (Morlet) amplitude of the detrended oscillations with a 95% confidence interval (red contours). Third column: Global wavelet power averaged over the whole time series (solid black line), red noise model (dashed grey line), and corresponding significant spectrum at 95% (dashed black line). The power spectra calculated from a Fourier analysis is also plotted for comparison (solid grey line).
Current usage metrics show cumulative count of Article Views (full-text article views including HTML views, PDF and ePub downloads, according to the available data) and Abstracts Views on Vision4Press platform.
Data correspond to usage on the plateform after 2015. The current usage metrics is available 48-96 hours after online publication and is updated daily on week days.
Initial download of the metrics may take a while.