Fig. 7.
Download original image
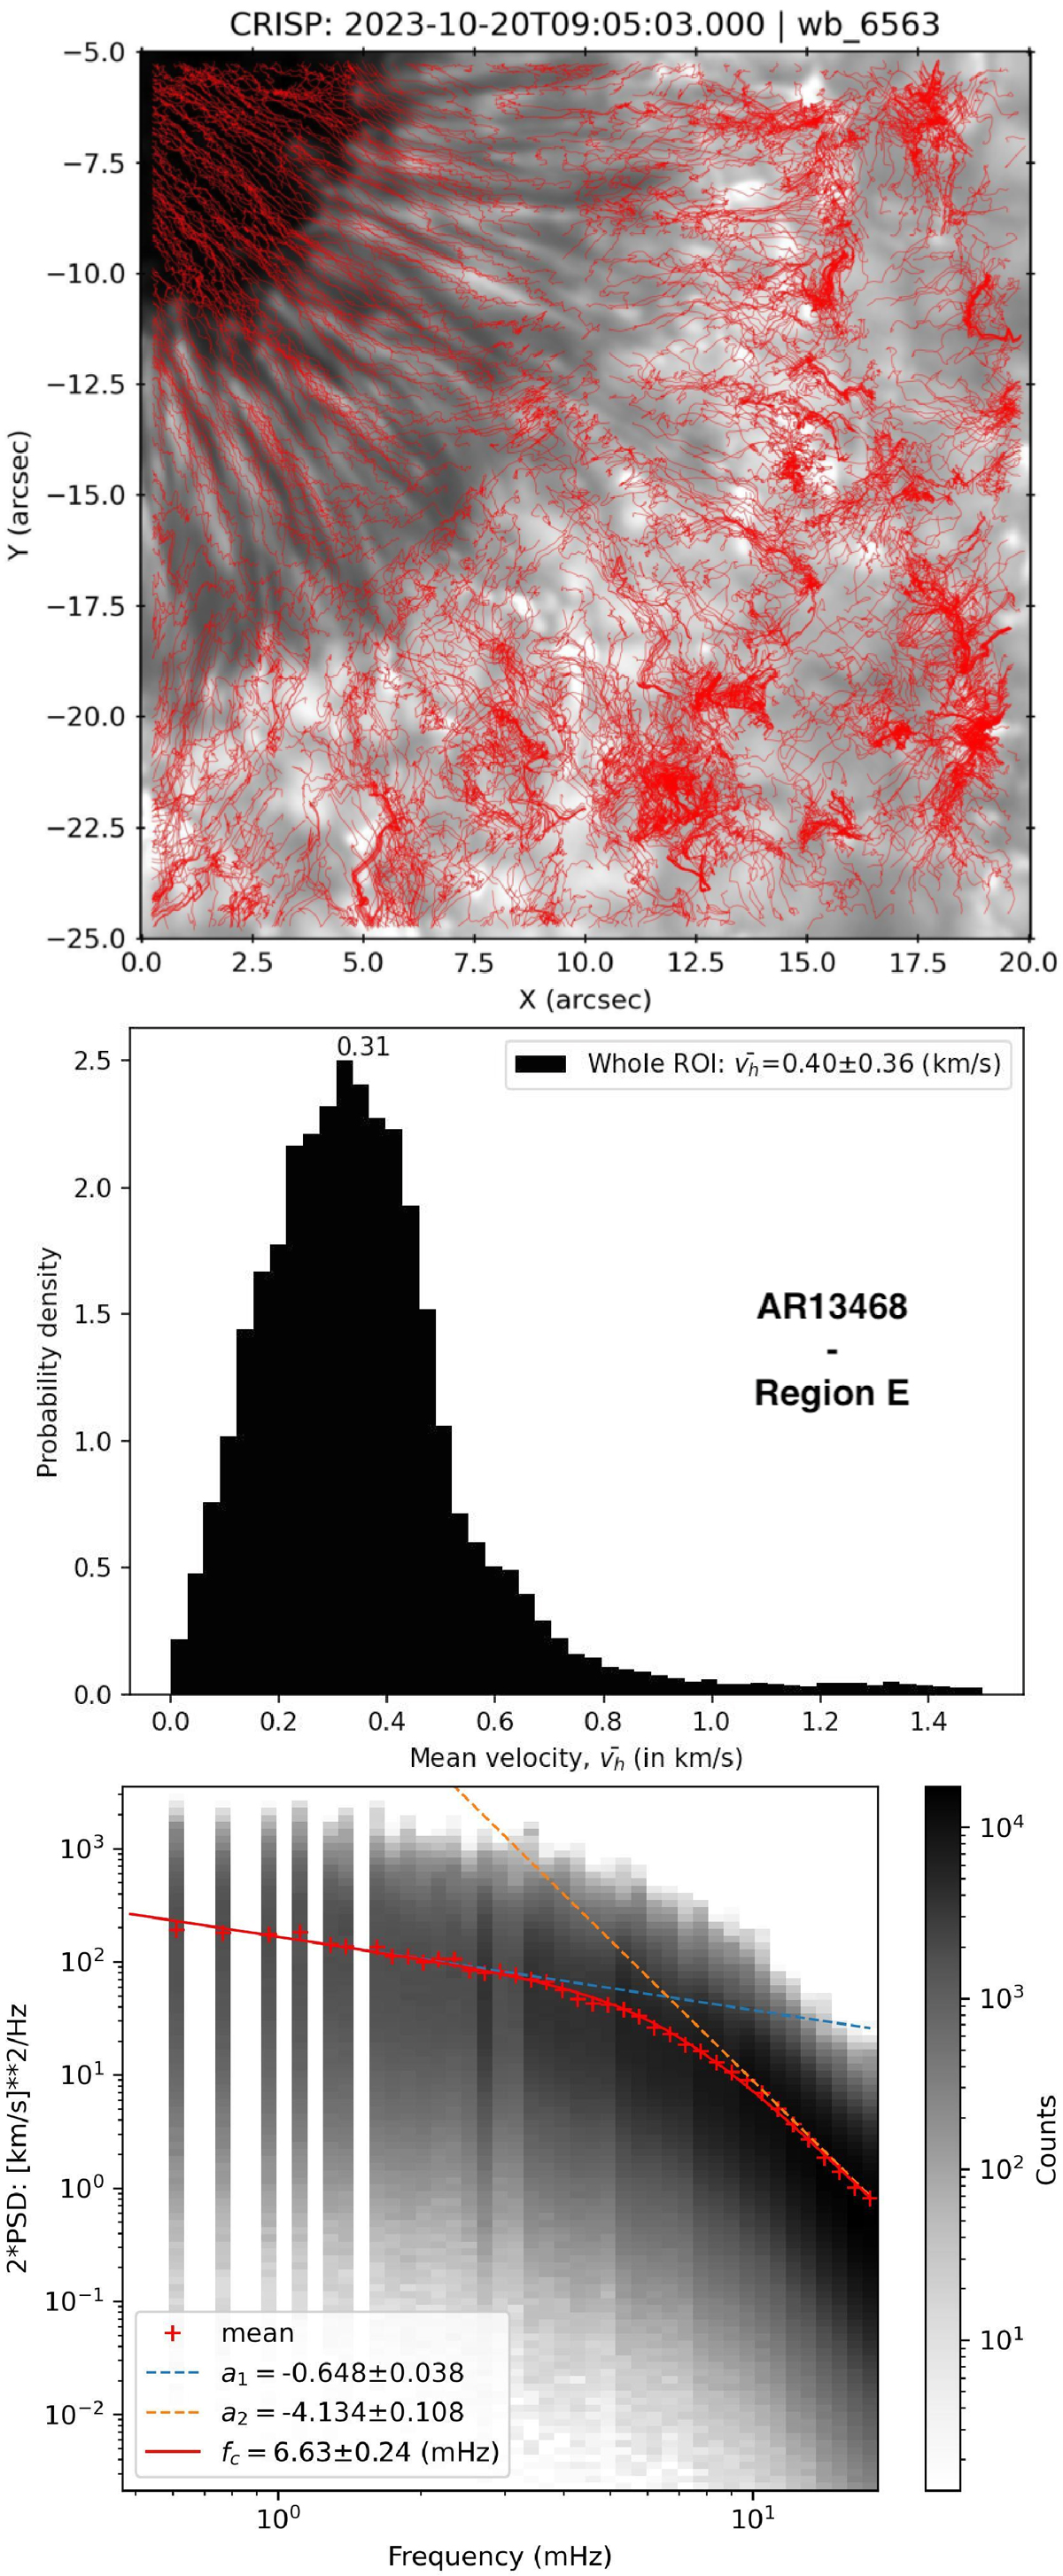
Photospheric motion analysis for the sunspot of AR13468 (region E) where coronal loops are seen to connect. The top panel shows the trajectories of corks from time t = 0 and over the full dataset duration (1 hour and 46 min). The corresponding ![]() -distribution and Fourier spectra along each trajectory are shown in the middle and bottom panels respectively in the same format as in Fig. 5.
-distribution and Fourier spectra along each trajectory are shown in the middle and bottom panels respectively in the same format as in Fig. 5.
Current usage metrics show cumulative count of Article Views (full-text article views including HTML views, PDF and ePub downloads, according to the available data) and Abstracts Views on Vision4Press platform.
Data correspond to usage on the plateform after 2015. The current usage metrics is available 48-96 hours after online publication and is updated daily on week days.
Initial download of the metrics may take a while.