Fig. 6.
Download original image
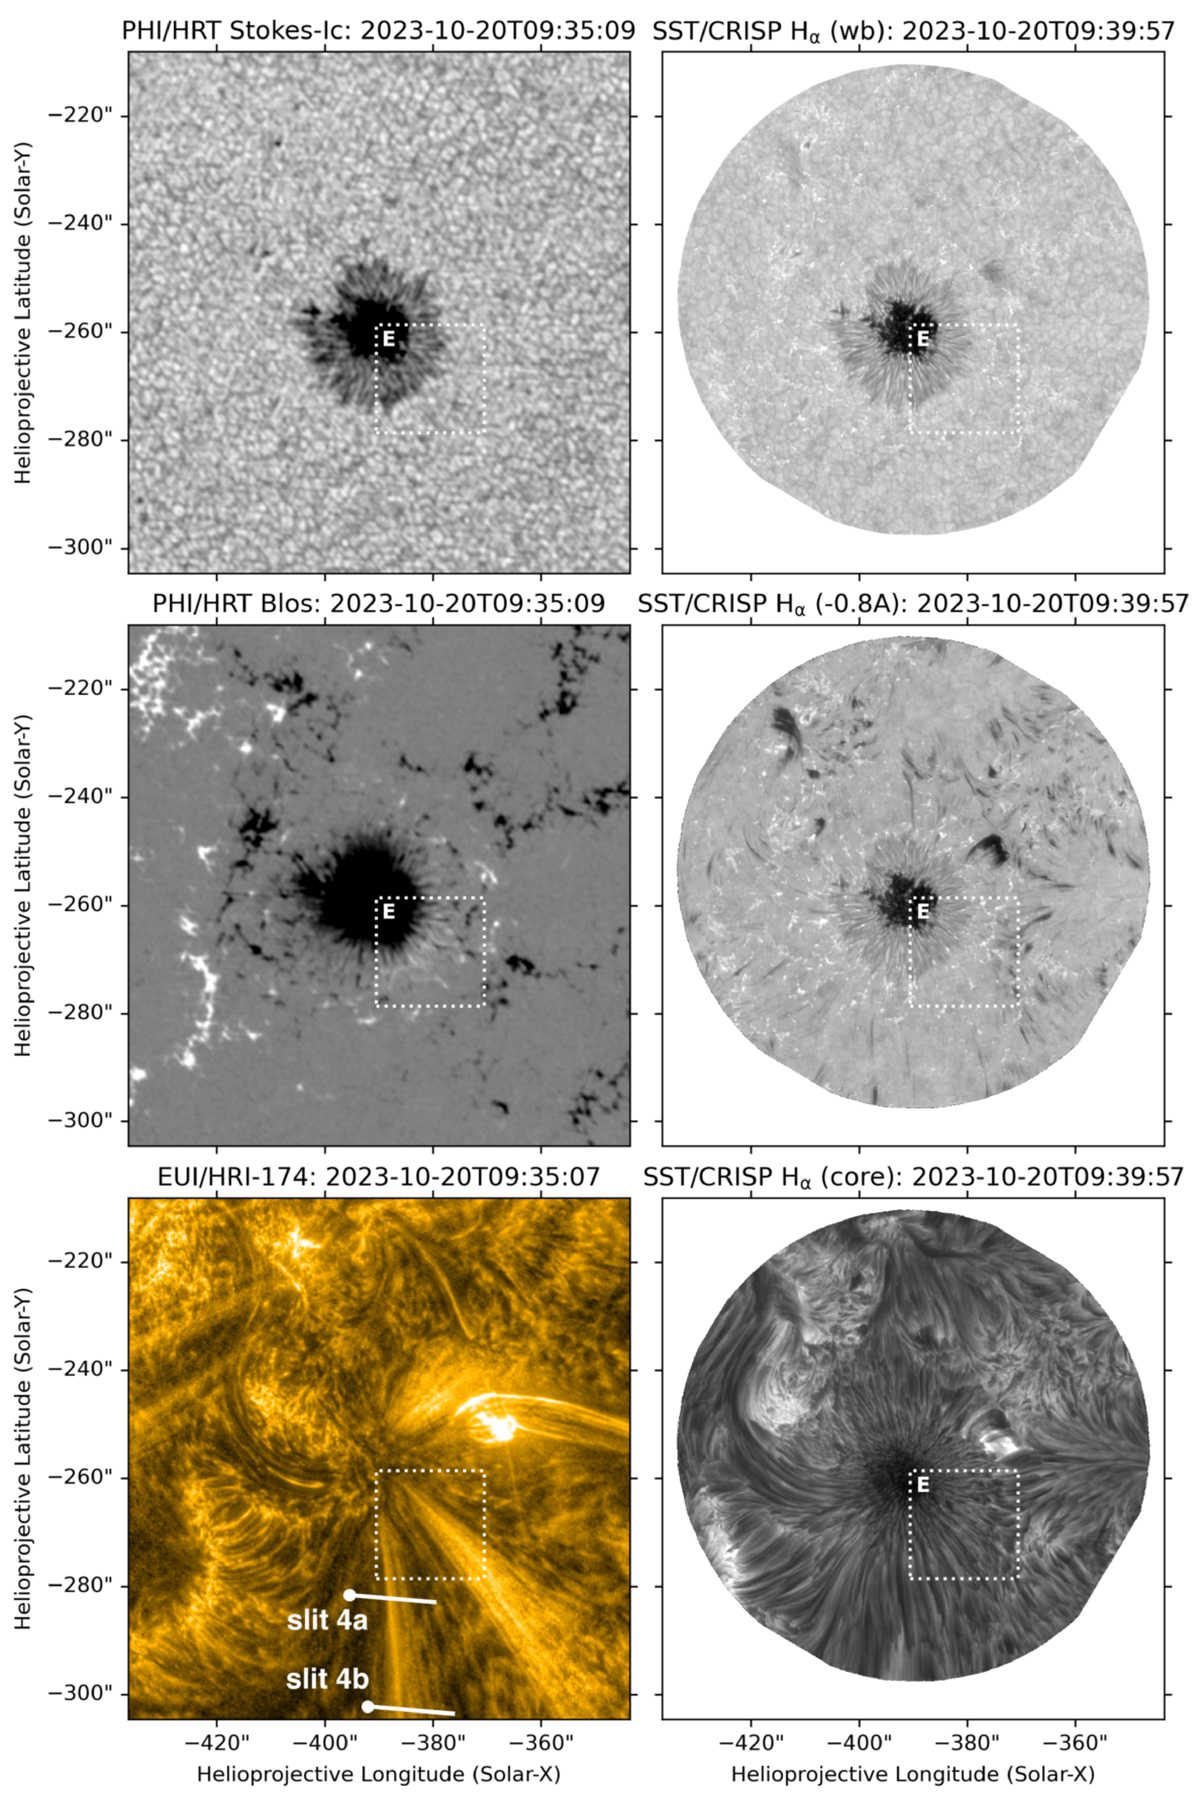
Cutout on the sunspot of AR13468. Left column: PHI/HRT and EUI/HRI observations re-projected on the SST/CRISP frame. Right column: SST/CRISP observations for the H α 6563 Å continuum (wide-band filter, top), −0.8 Å blue wing (middle) and line core (bottom). The white rectangle depicts the sub-region selected for the photospheric motion analysis. The intensities are colour-plotted on a logarithmic scale (only the values between the 0.1% ad 99.9% percentiles are mapped). The artificial slits traced in white colour are used later for the coronal oscillation analysis.
Current usage metrics show cumulative count of Article Views (full-text article views including HTML views, PDF and ePub downloads, according to the available data) and Abstracts Views on Vision4Press platform.
Data correspond to usage on the plateform after 2015. The current usage metrics is available 48-96 hours after online publication and is updated daily on week days.
Initial download of the metrics may take a while.