Fig. 5.
Download original image
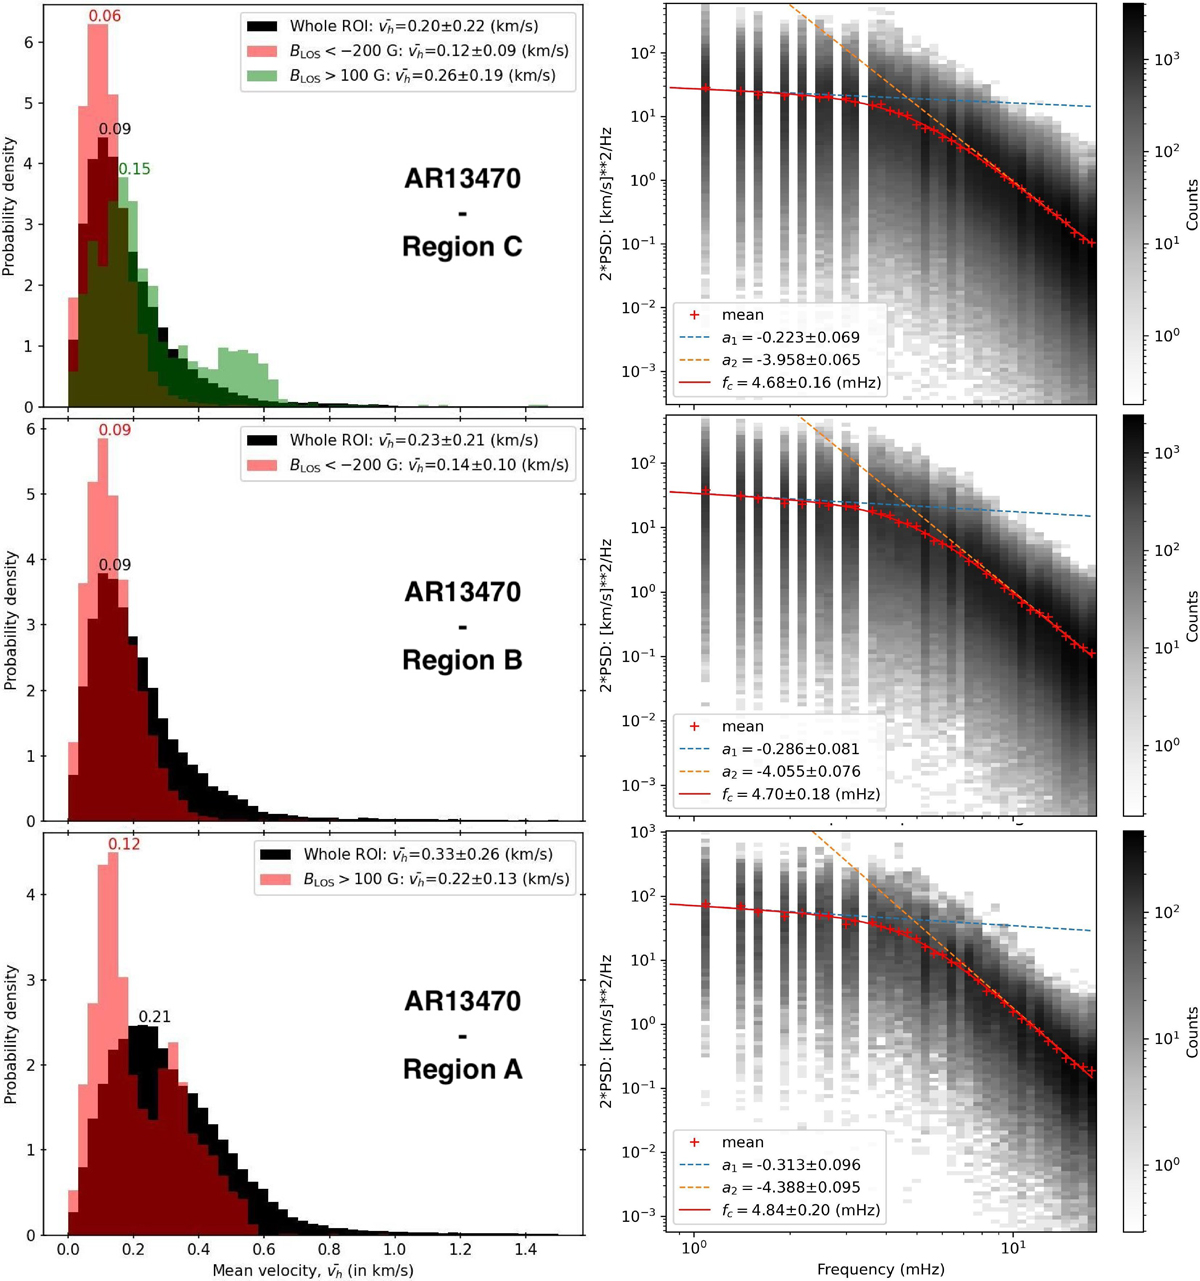
Photospheric motion analysis on AR13470 for the SST/CRISP sub-region A (bottom row), B (middle row), and C (top row). Left column: Distribution of the temporal averages ![]() over the whole time series. Right column: Fourier spectra of the power spectral density (PSD) for the sub-selection of trajectories corresponding to the red distributions, colour-plotted as 2-D histograms on a log-scale, and with the two power-law fitting (dashed lines).
over the whole time series. Right column: Fourier spectra of the power spectral density (PSD) for the sub-selection of trajectories corresponding to the red distributions, colour-plotted as 2-D histograms on a log-scale, and with the two power-law fitting (dashed lines).
Current usage metrics show cumulative count of Article Views (full-text article views including HTML views, PDF and ePub downloads, according to the available data) and Abstracts Views on Vision4Press platform.
Data correspond to usage on the plateform after 2015. The current usage metrics is available 48-96 hours after online publication and is updated daily on week days.
Initial download of the metrics may take a while.