Fig. 2.
Download original image
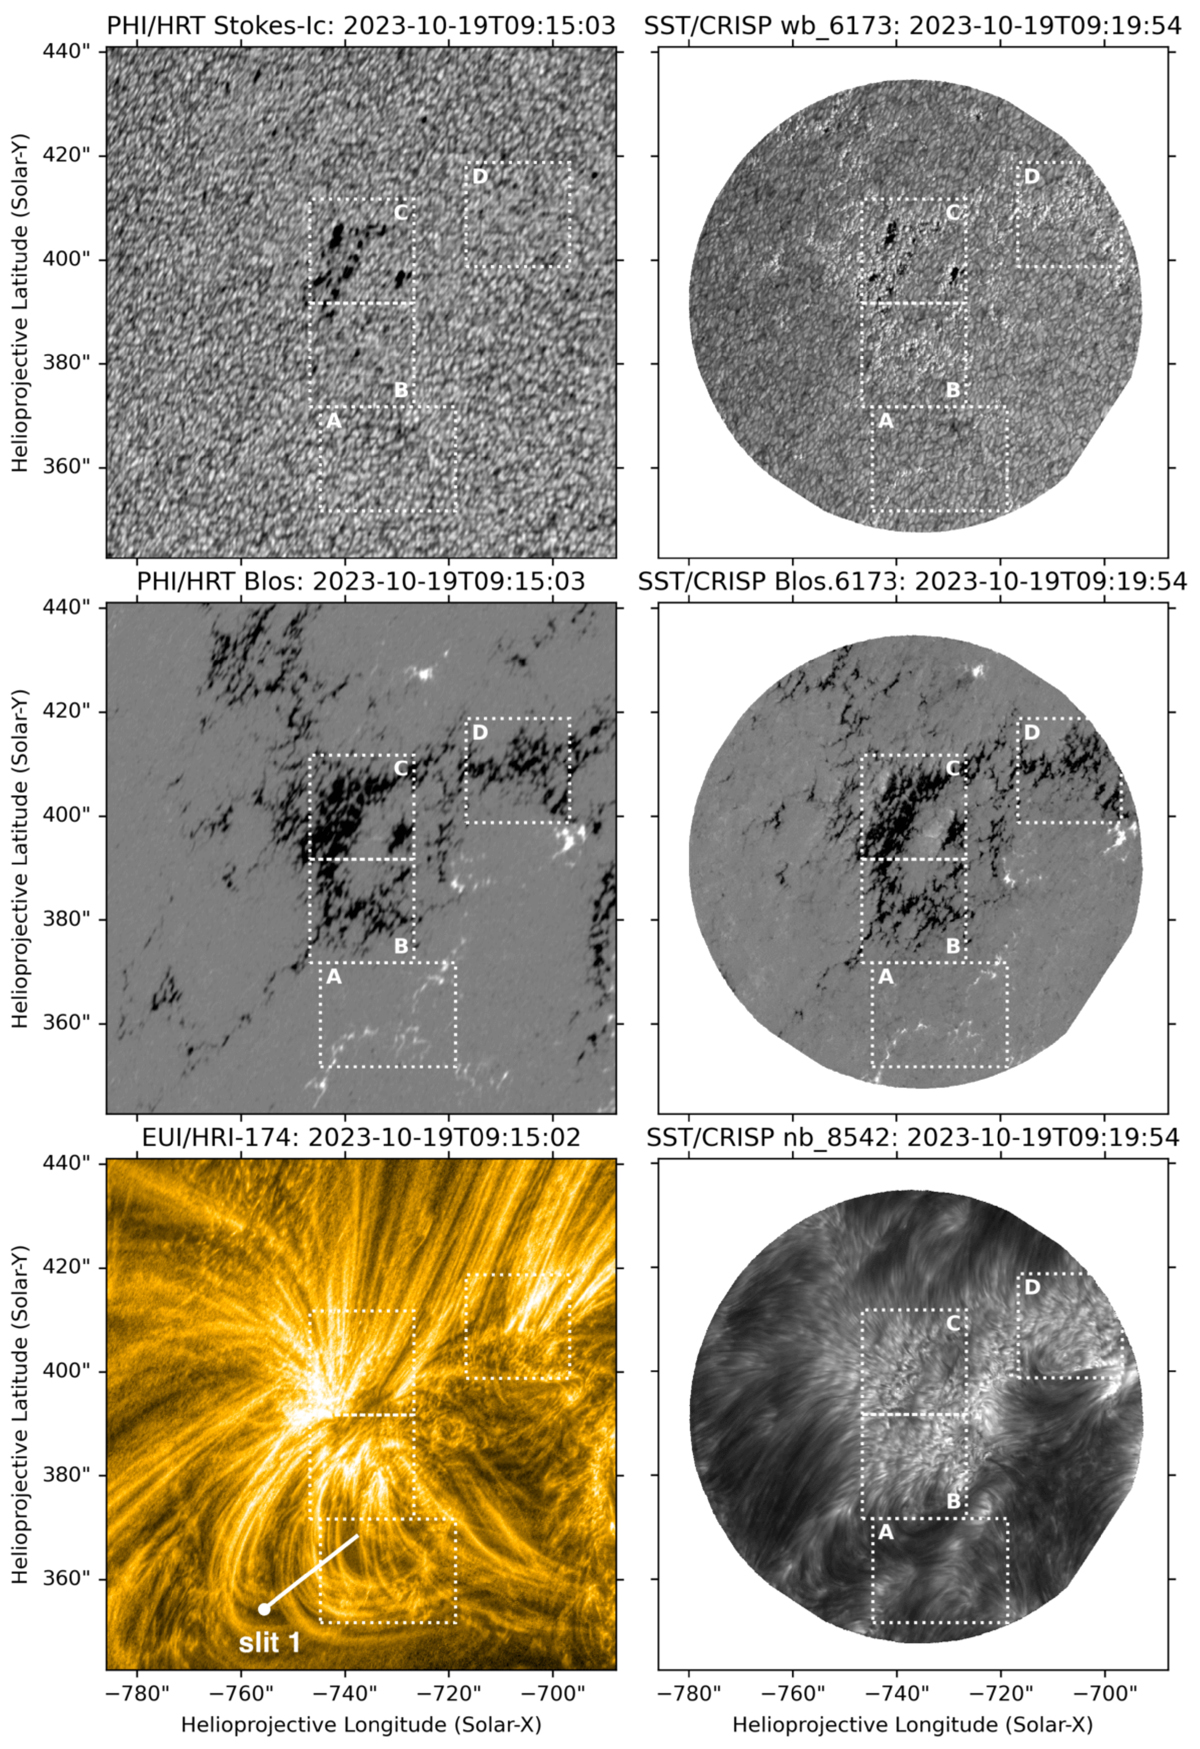
Cutout centred on the core of AR13470. Left column: PHI/HRT and EUI/HRI observations re-projected on the SST/CRISP frame. Right column: SST/CRISP observations for the Fe I 6173 Å continuum (wide-band filter, top), inverted LOS magnetic field (middle) and line core of Ca II 8542 Å (bottom). The white rectangles depict the sub-regions selected for the photospheric motion analyses (see text). The continuum intensities are colour-plotted on a logarithmic scale (only the values between the 0.1% ad 99.9% percentiles are mapped). The LOS magnetic field maps are shown on a linear scale ranging −500 G (black colours) to 500 G (white colours). The artificial slit traced in white colour is used later for the coronal oscillation analysis.
Current usage metrics show cumulative count of Article Views (full-text article views including HTML views, PDF and ePub downloads, according to the available data) and Abstracts Views on Vision4Press platform.
Data correspond to usage on the plateform after 2015. The current usage metrics is available 48-96 hours after online publication and is updated daily on week days.
Initial download of the metrics may take a while.