Open Access
Fig. D.4.
Download original image
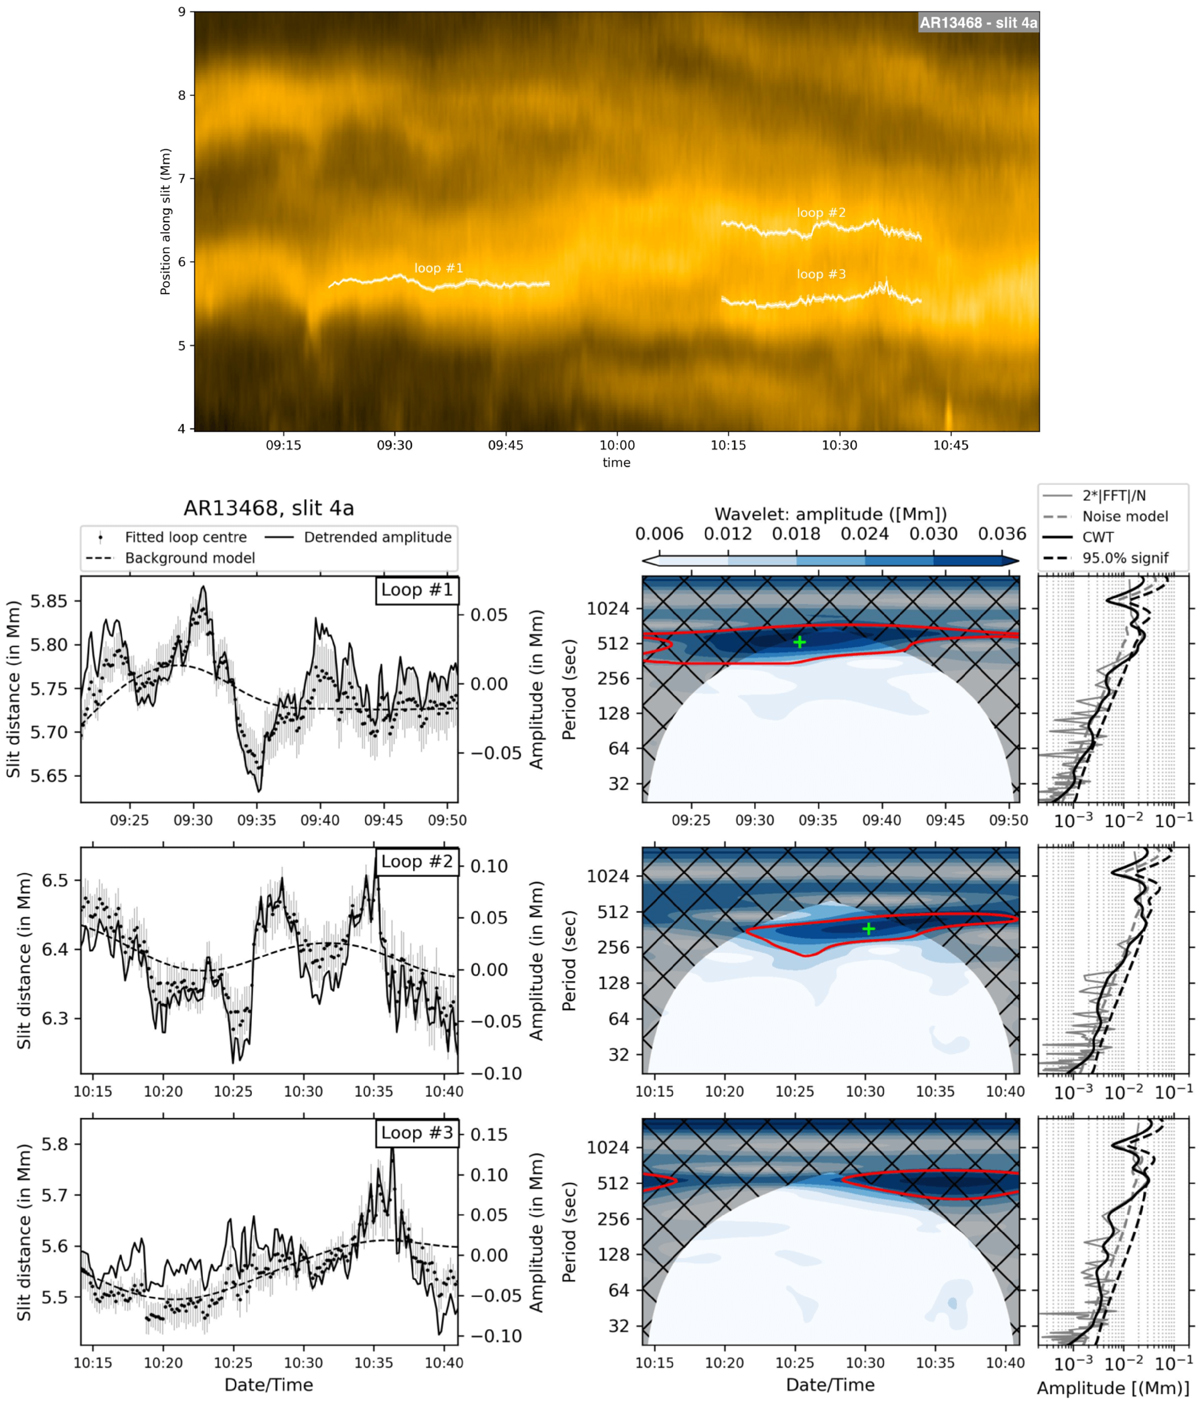
Coronal oscillation analyses for the loops connected to the sunspot of AR13468; slit 4a. Top panel: Time-distance map of the EUI/HRI intensity along slit 4a along with the fitted loops (solid white lines). Lower panels: Corresponding wavelet analyses following the same format as in Fig. 9.
Current usage metrics show cumulative count of Article Views (full-text article views including HTML views, PDF and ePub downloads, according to the available data) and Abstracts Views on Vision4Press platform.
Data correspond to usage on the plateform after 2015. The current usage metrics is available 48-96 hours after online publication and is updated daily on week days.
Initial download of the metrics may take a while.