Fig. 1.
Download original image
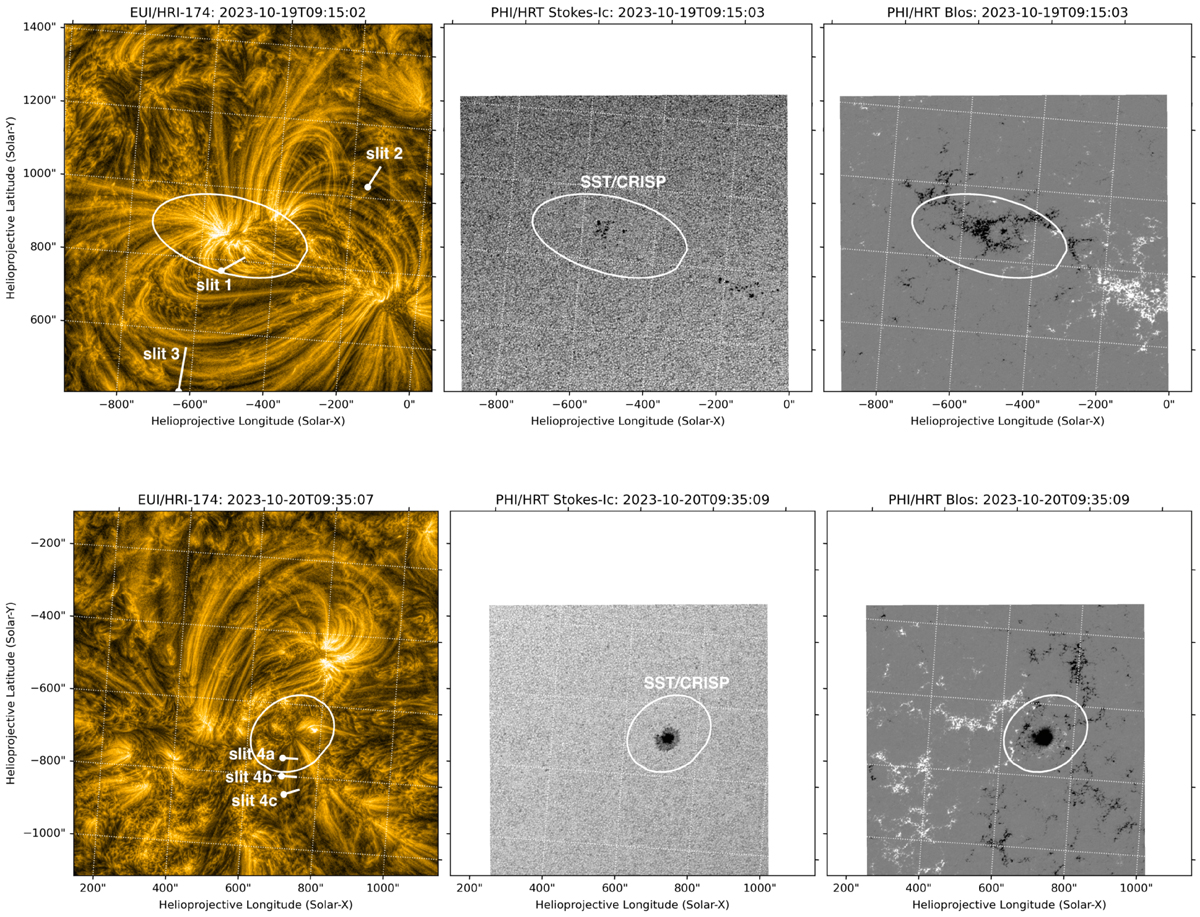
Context view of AR13470 (top row) and AR13468 (bottom row) observed on 19 and 20 October 2023, respectively. Left column: WoW-enhanced EUI/HRI-174Å images with the slits (white lines) used for the coronal oscillation analysis. Middle column: Stokes-I continuum from PHI/HRT. Right column: PHI/HRT inverted line of sight (LOS) component of the magnetic field, linearly scaled between −500 G (black colours) to 500 G (white colours). The white ellipse shows the re-projected SST/CRISP FOV. The thin white dashed lines represent the helioprojective coordinate frame as seen from Solar Orbiter.
Current usage metrics show cumulative count of Article Views (full-text article views including HTML views, PDF and ePub downloads, according to the available data) and Abstracts Views on Vision4Press platform.
Data correspond to usage on the plateform after 2015. The current usage metrics is available 48-96 hours after online publication and is updated daily on week days.
Initial download of the metrics may take a while.