Fig. 9.
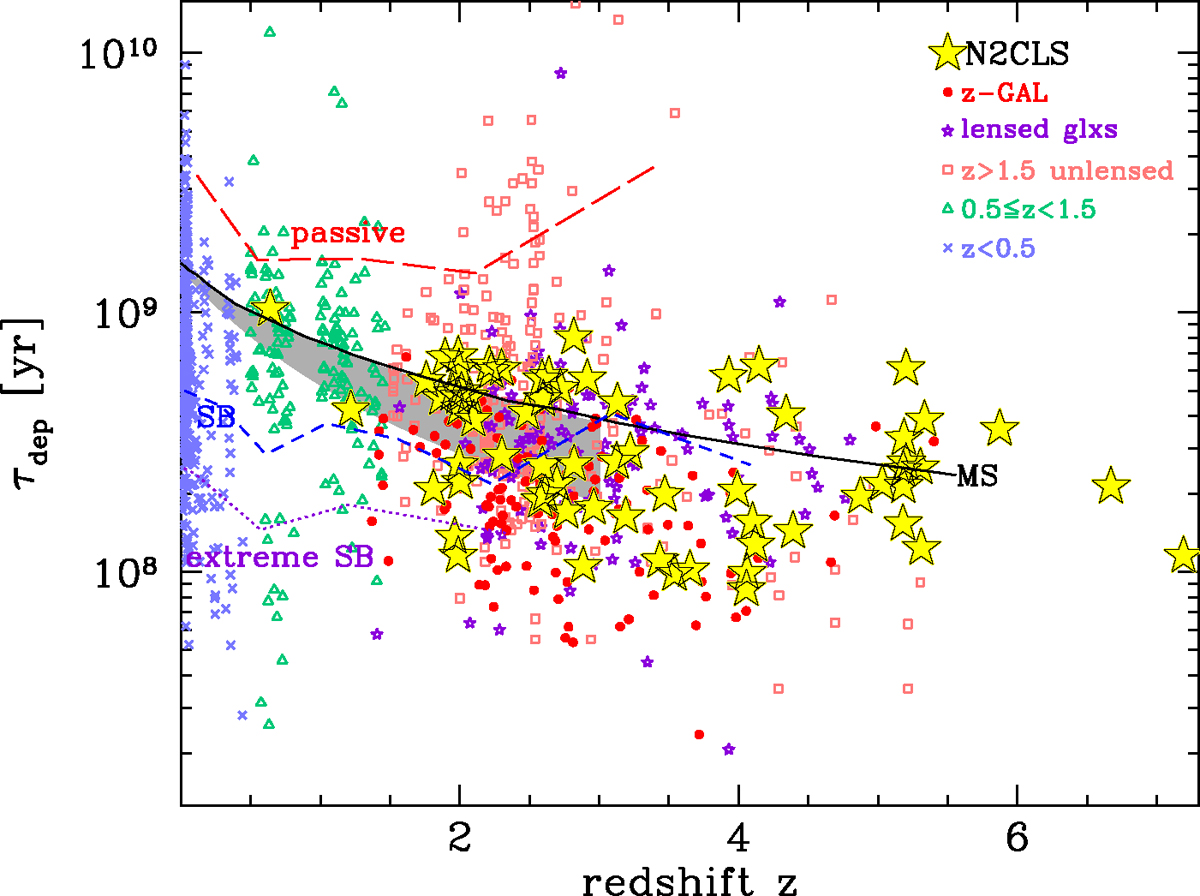
Download original image
Depletion timescale of the N2GN galaxies obtained applying the Tacconi et al. (2020) scaling relation. The gray shaded area is the trend found by Saintonge et al. (2013). The different lines represent the trends found by Tacconi et al. (2020) for: main sequence galaxies (selected within ΔMS = ±0.6 dex, black solid line); starburst galaxies (ΔMS > 0.6 dex, blue dashed line); extreme starbursts (ΔMS > 1.2 dex, purple dotted line); below-MS galaxies (ΔMS < 0.4 dex, red long-dashed line). Literature data are from Alaghband-Zadeh et al. (2013), Aravena et al. (2016, 2014, 2013), Bakx et al. (2020), Berta et al. (2023), Bothwell et al. (2017, 2013), Carilli et al. (2010), Chung et al. (2009), Combes et al. (2011, Combes et al. (2013, Dannerbauer et al. (2019), Decarli et al. (2016, 2019), Dunne et al. (2021, 2020), Fujimoto et al. (2017), Freundlich et al. (2019), Geach et al. (2011), Genzel et al. (2015, 2003), George et al. (2013), Hagimoto et al. (2023), Harris et al. (2012, 2010), Ivison et al. (2013, 2011, 2010), Penney et al. (2020), Riechers et al. (2020, 2011), Rudnick et al. (2017), Sharon et al. (2016), Solomon et al. (1997), Tacconi et al. (2018, 2013), Thomson et al. (2012), Valentino et al. (2018), Villanueva et al. (2017), Wang et al. (2018), and Yang et al. (2017).
Current usage metrics show cumulative count of Article Views (full-text article views including HTML views, PDF and ePub downloads, according to the available data) and Abstracts Views on Vision4Press platform.
Data correspond to usage on the plateform after 2015. The current usage metrics is available 48-96 hours after online publication and is updated daily on week days.
Initial download of the metrics may take a while.