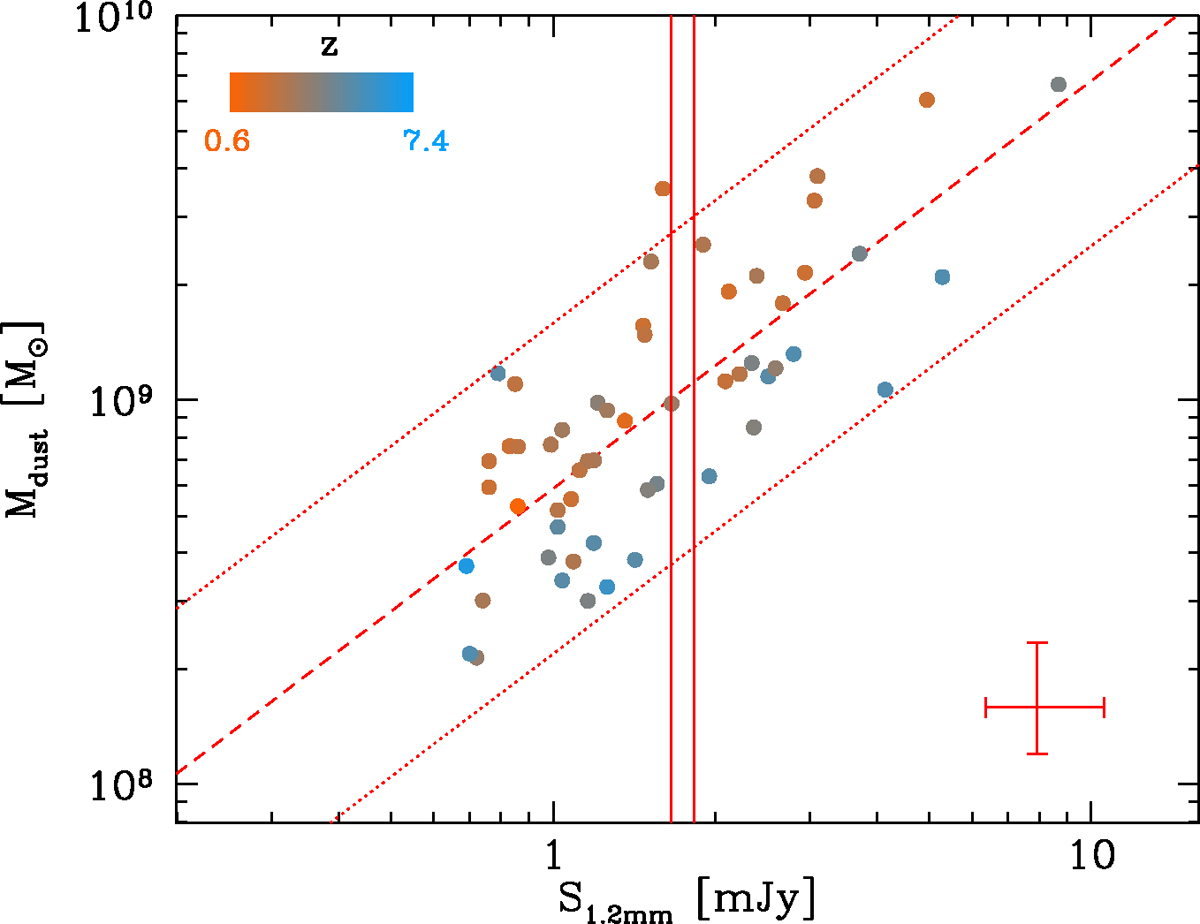
Fig. 7.
Download original image
Distribution of the N2GN galaxies as a function of dust mass and 1.2 mm flux density, color coded on the basis of their redshift. Median error bars are shown in the bottom-right corner. The red dashed line is a least squares fit to the data. The red dotted lines represent the same line scaled to the 2.5th and 97.5th percentiles of the residuals distribution. The red, solid vertical lines mark the flux of the sources with no redshift measurement and multi-wavelength counterparts available.
Current usage metrics show cumulative count of Article Views (full-text article views including HTML views, PDF and ePub downloads, according to the available data) and Abstracts Views on Vision4Press platform.
Data correspond to usage on the plateform after 2015. The current usage metrics is available 48-96 hours after online publication and is updated daily on week days.
Initial download of the metrics may take a while.