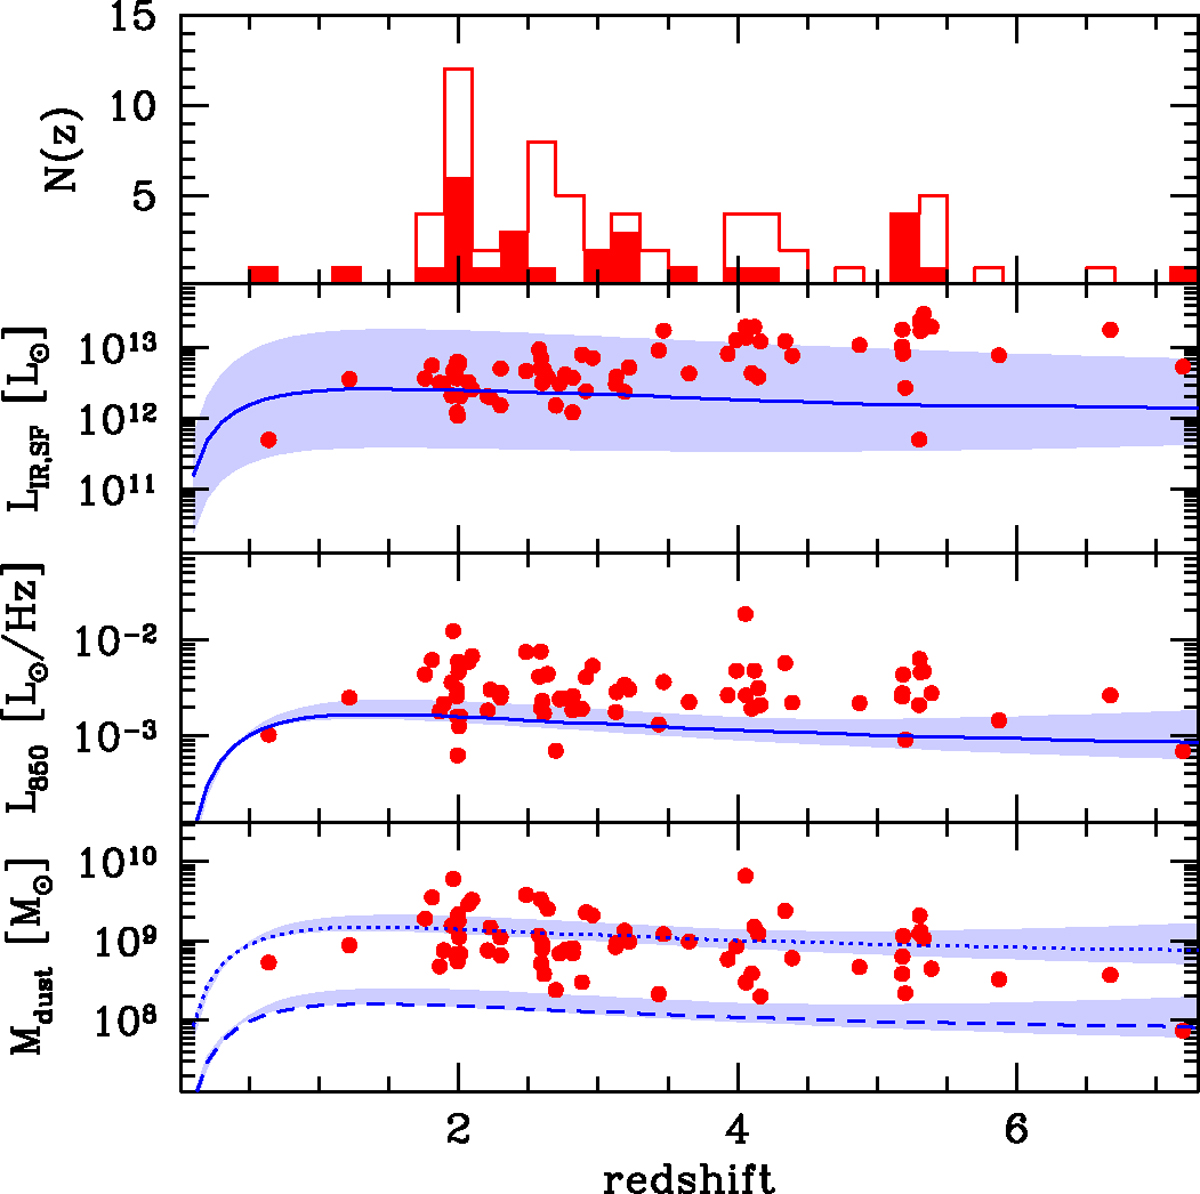
Fig. 6.
Download original image
Distribution of the N2GN galaxies, their luminosity, and dust mass as a function of redshift. Top panel: Redshift distribution. The filled histogram includes the sources with spectroscopic redshift, while the open histogram includes all sources. Second panel: Infrared luminosity of the star forming component, integrated between 8 and 1000 μm. The blue solid line represents the expected luminosity for a source of 0.7 mJy in the NIKA2 1.2 mm band, assuming its emission is described by the median SED shown in the left panel of Fig. 5. The shaded area is given by the best fit models of all sources. Third: 850 μm monochromatic luminosity. Bottom panel: Dust mass distribution as a function of redshift. The dashed and dotted lines represent the minimum dust mass and maximal-completeness dust mass obtained rescaling the L850 versus z line adopting the minimum and maximum Mdust/L850 ratio in the sample (Sect. 6.1).
Current usage metrics show cumulative count of Article Views (full-text article views including HTML views, PDF and ePub downloads, according to the available data) and Abstracts Views on Vision4Press platform.
Data correspond to usage on the plateform after 2015. The current usage metrics is available 48-96 hours after online publication and is updated daily on week days.
Initial download of the metrics may take a while.