Fig. 15.
Download original image
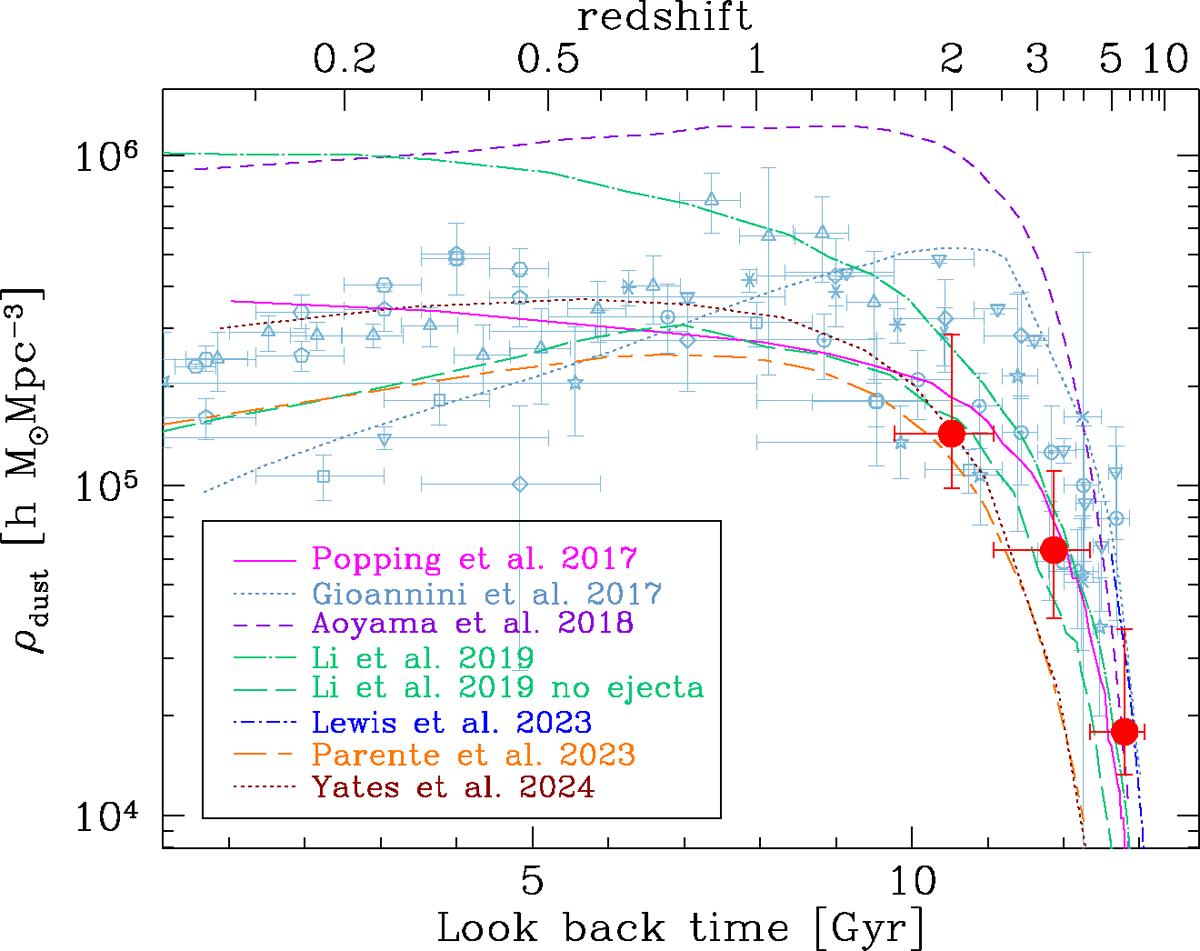
Comparison of the dust mass density to model predictions. The N2GN results are depicted as red filled circles. The different lines represent the semi-analytical models by Popping et al. (2017), Parente et al. (2023) and Yates et al. (2024), the chemical evolution model by Gioannini et al. (2017), and the cosmological hydrodynamical simulations by Lewis et al. (2023), Li et al. (2019) and Aoyama et al. (2018). Figure D.1 presents a version of this figure as a function of redshift.
Current usage metrics show cumulative count of Article Views (full-text article views including HTML views, PDF and ePub downloads, according to the available data) and Abstracts Views on Vision4Press platform.
Data correspond to usage on the plateform after 2015. The current usage metrics is available 48-96 hours after online publication and is updated daily on week days.
Initial download of the metrics may take a while.