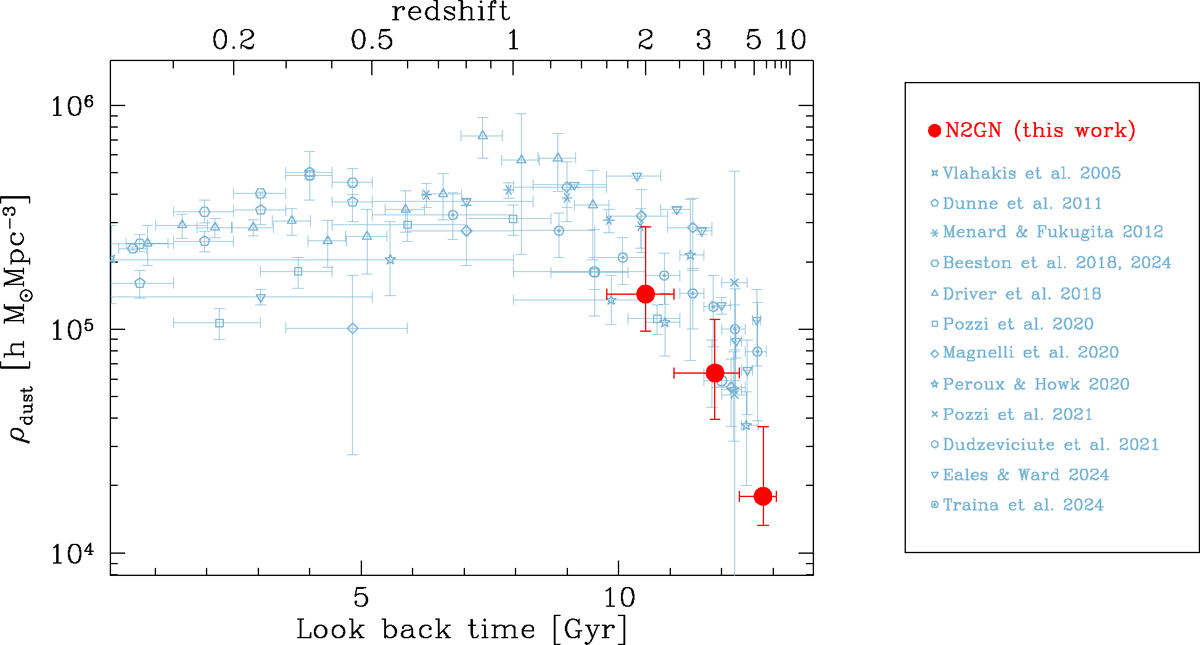
Fig. 14.
Download original image
Evolution of the dust mass density as a function of look-back time. The N2GN results are depicted as red filled circles. All other symbols belong to literature data, as indicated in the right-hand panel. Local estimates are by Vlahakis et al. (2005) and Beeston et al. (2018); combinations of optical-NIR and FIR-sub-millimeter data are by Eales & Ward (2024) and Driver et al. (2018); Herschel-based studies are by Beeston et al. (2024), Pozzi et al. (2020) and Dunne et al. (2011); sub-millimeter and millimeter driven results are by Pozzi et al. (2021), Dudzevičiūtė et al. (2021), and Magnelli et al. (2020); and finally derivations of ρdust are based on Ωgas (Péroux & Howk 2020) and MgII absorbers (Ménard & Fukugita 2012). All data have been rescaled to our chosen cosmology and κν (Draine et al. 2014). Figure C.1 presents a full-color version and Fig. D.1 shows ρdust as a function of redshift.
Current usage metrics show cumulative count of Article Views (full-text article views including HTML views, PDF and ePub downloads, according to the available data) and Abstracts Views on Vision4Press platform.
Data correspond to usage on the plateform after 2015. The current usage metrics is available 48-96 hours after online publication and is updated daily on week days.
Initial download of the metrics may take a while.