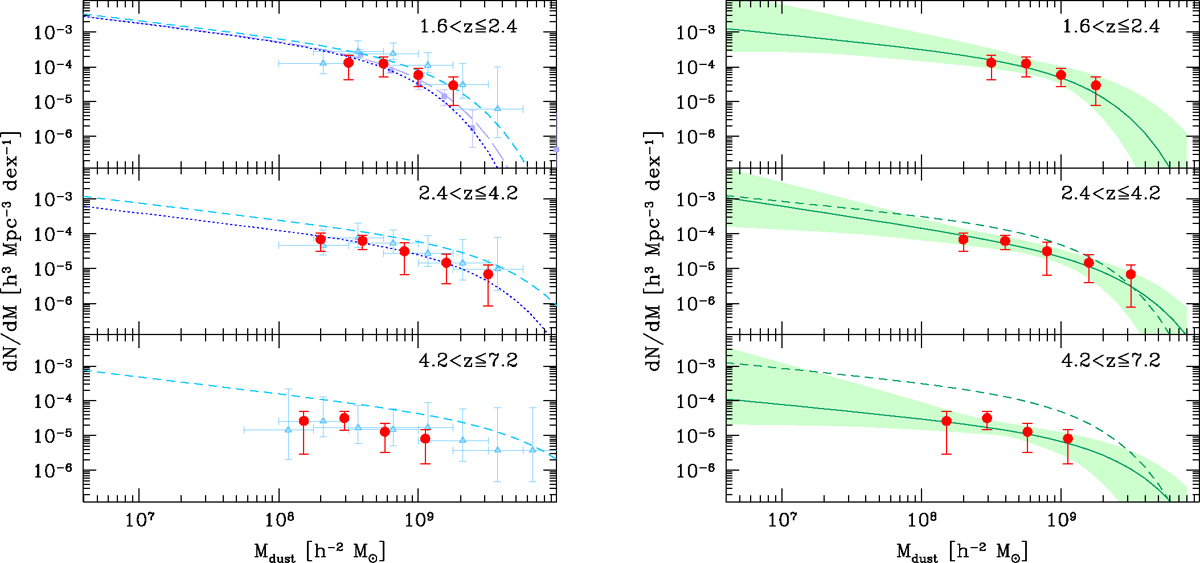
Fig. 13.
Download original image
Dust mass function of the N2GN sources (red symbols). Only the mass bins containing at least two galaxies and with a completeness ≥50% are plotted. Uncertainties take into account ΔMdust, including SED fitting parameters sampling and Δz contributions, and Poisson errors. Left panel: comparison to literature results by Pozzi et al. (2020, blue filled squares and long-dashed line) and Traina et al. (2024a, light blue triangles and short-dashed lines, fiducial results in the 2.0 < z ≤ 2.5, 3.5 < z ≤ 4.5 and 4.5 < z ≤ 6.0 redshift bins). The blue dotted lines are the same Pozzi et al. (2020) DMF, evolved to z = 2.0 and 3.3 (see Sect. 6.2). Right panel: results of the STY analysis. The green solid lines and shaded areas are the result of the STY parametric analysis: most probable model (solid lines) and 1σ uncertainty (shaded areas). The dashed green lines represent the 1.6 < z ≤ 2.4 result, repeated in the other two redshift bins for comparison.
Current usage metrics show cumulative count of Article Views (full-text article views including HTML views, PDF and ePub downloads, according to the available data) and Abstracts Views on Vision4Press platform.
Data correspond to usage on the plateform after 2015. The current usage metrics is available 48-96 hours after online publication and is updated daily on week days.
Initial download of the metrics may take a while.