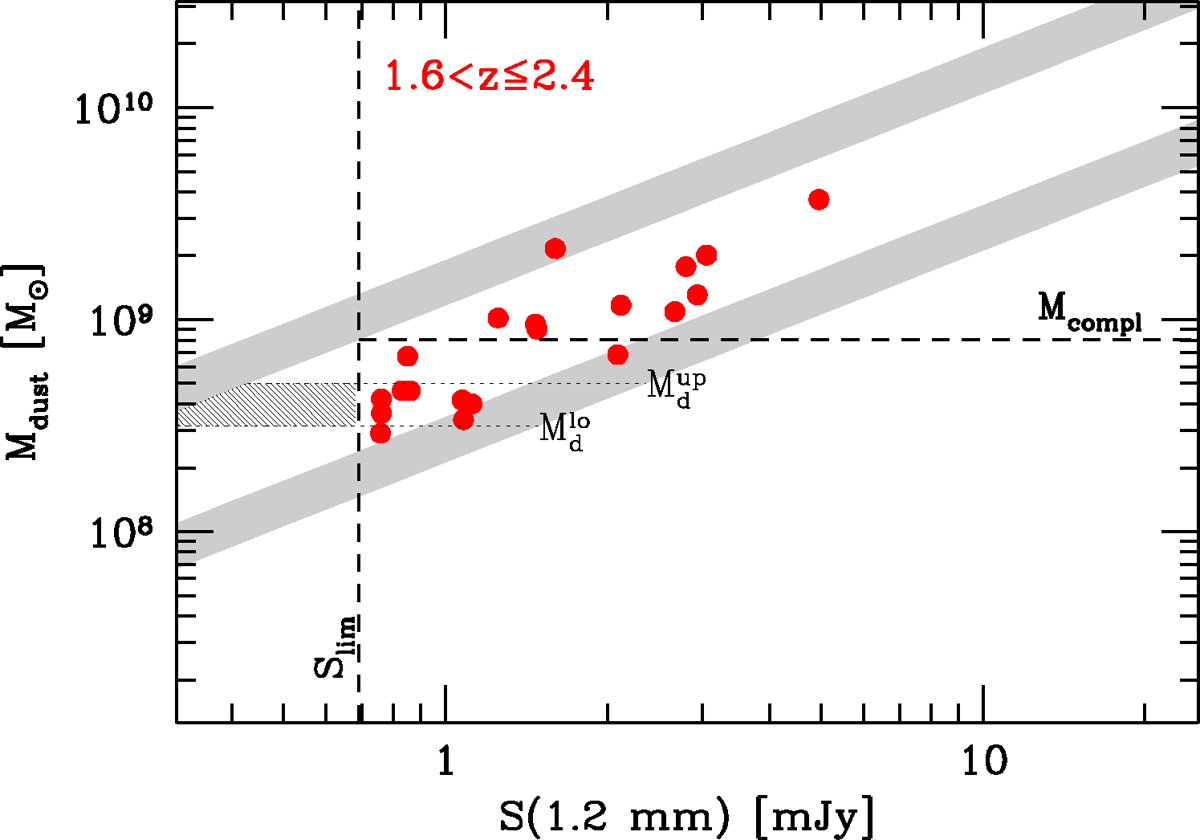
Fig. 12.
Download original image
Exemplification of how the dust mass completeness is computed in the redshift bin 1.6 < z ≤ 2.4 (Sect. 6.1). The diagonal shaded areas represent tracks of the N2GN SED models, given the minimum and maximum Mdust/L850 ratios in the sample. The vertical dashed line is the 1.2 mm flux limit of the survey, and the horizontal dashed line is the corresponding mass maximal completeness threshold. The dotted horizontal lines mark the boundaries of an example mass bin, in which the hatched area would contain the sources missed by the flux cut.
Current usage metrics show cumulative count of Article Views (full-text article views including HTML views, PDF and ePub downloads, according to the available data) and Abstracts Views on Vision4Press platform.
Data correspond to usage on the plateform after 2015. The current usage metrics is available 48-96 hours after online publication and is updated daily on week days.
Initial download of the metrics may take a while.