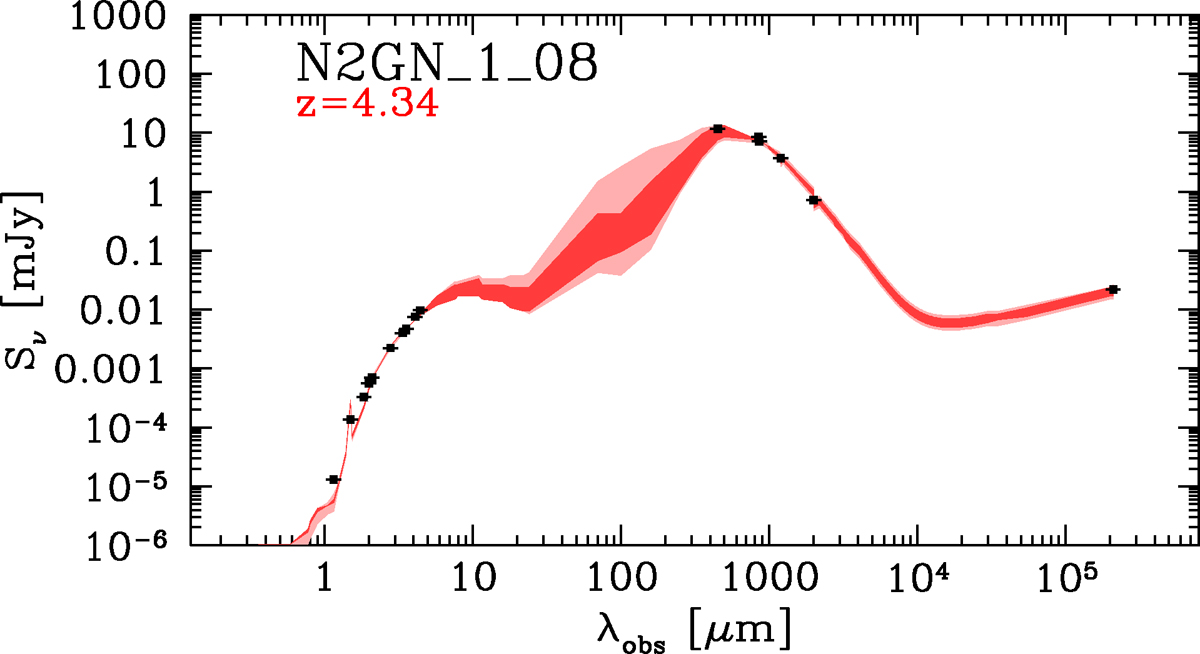
Fig. 11.
Download original image
Example of fit uncertainty when no NIR and MIR data are available and a big gap in wavelength exists between the rest-frame optical and FIR spectral domains. The two different tones of red shaded areas represent the 2.5%, 16% 84% and 97.5% percentiles of the models, as computed in the photometric bands of the input catalog; the corresponding M⋆ range is as large as 0.25 dex (2.5th to 97.5th percentiles).
Current usage metrics show cumulative count of Article Views (full-text article views including HTML views, PDF and ePub downloads, according to the available data) and Abstracts Views on Vision4Press platform.
Data correspond to usage on the plateform after 2015. The current usage metrics is available 48-96 hours after online publication and is updated daily on week days.
Initial download of the metrics may take a while.