Fig. 9
Download original image
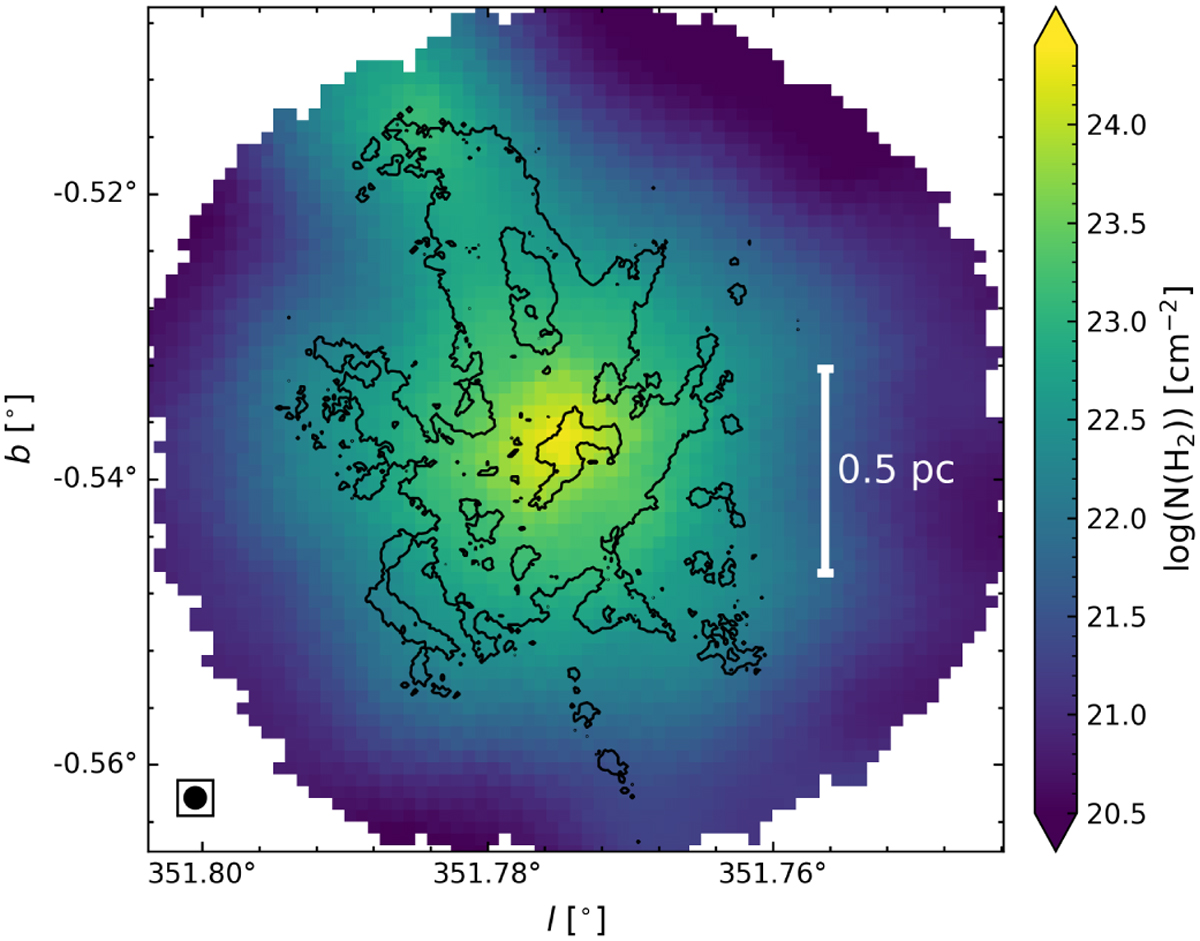
H2 column density map from Dell’Ova et al. (2024) of the G351.77 protocluster. The black contour represents the spectra with NT(N2H+) > 1 × 1013 cm−2. The circle on the bottom left represents the beam size of 6″ × 6″.
Current usage metrics show cumulative count of Article Views (full-text article views including HTML views, PDF and ePub downloads, according to the available data) and Abstracts Views on Vision4Press platform.
Data correspond to usage on the plateform after 2015. The current usage metrics is available 48-96 hours after online publication and is updated daily on week days.
Initial download of the metrics may take a while.