Fig. 7
Download original image
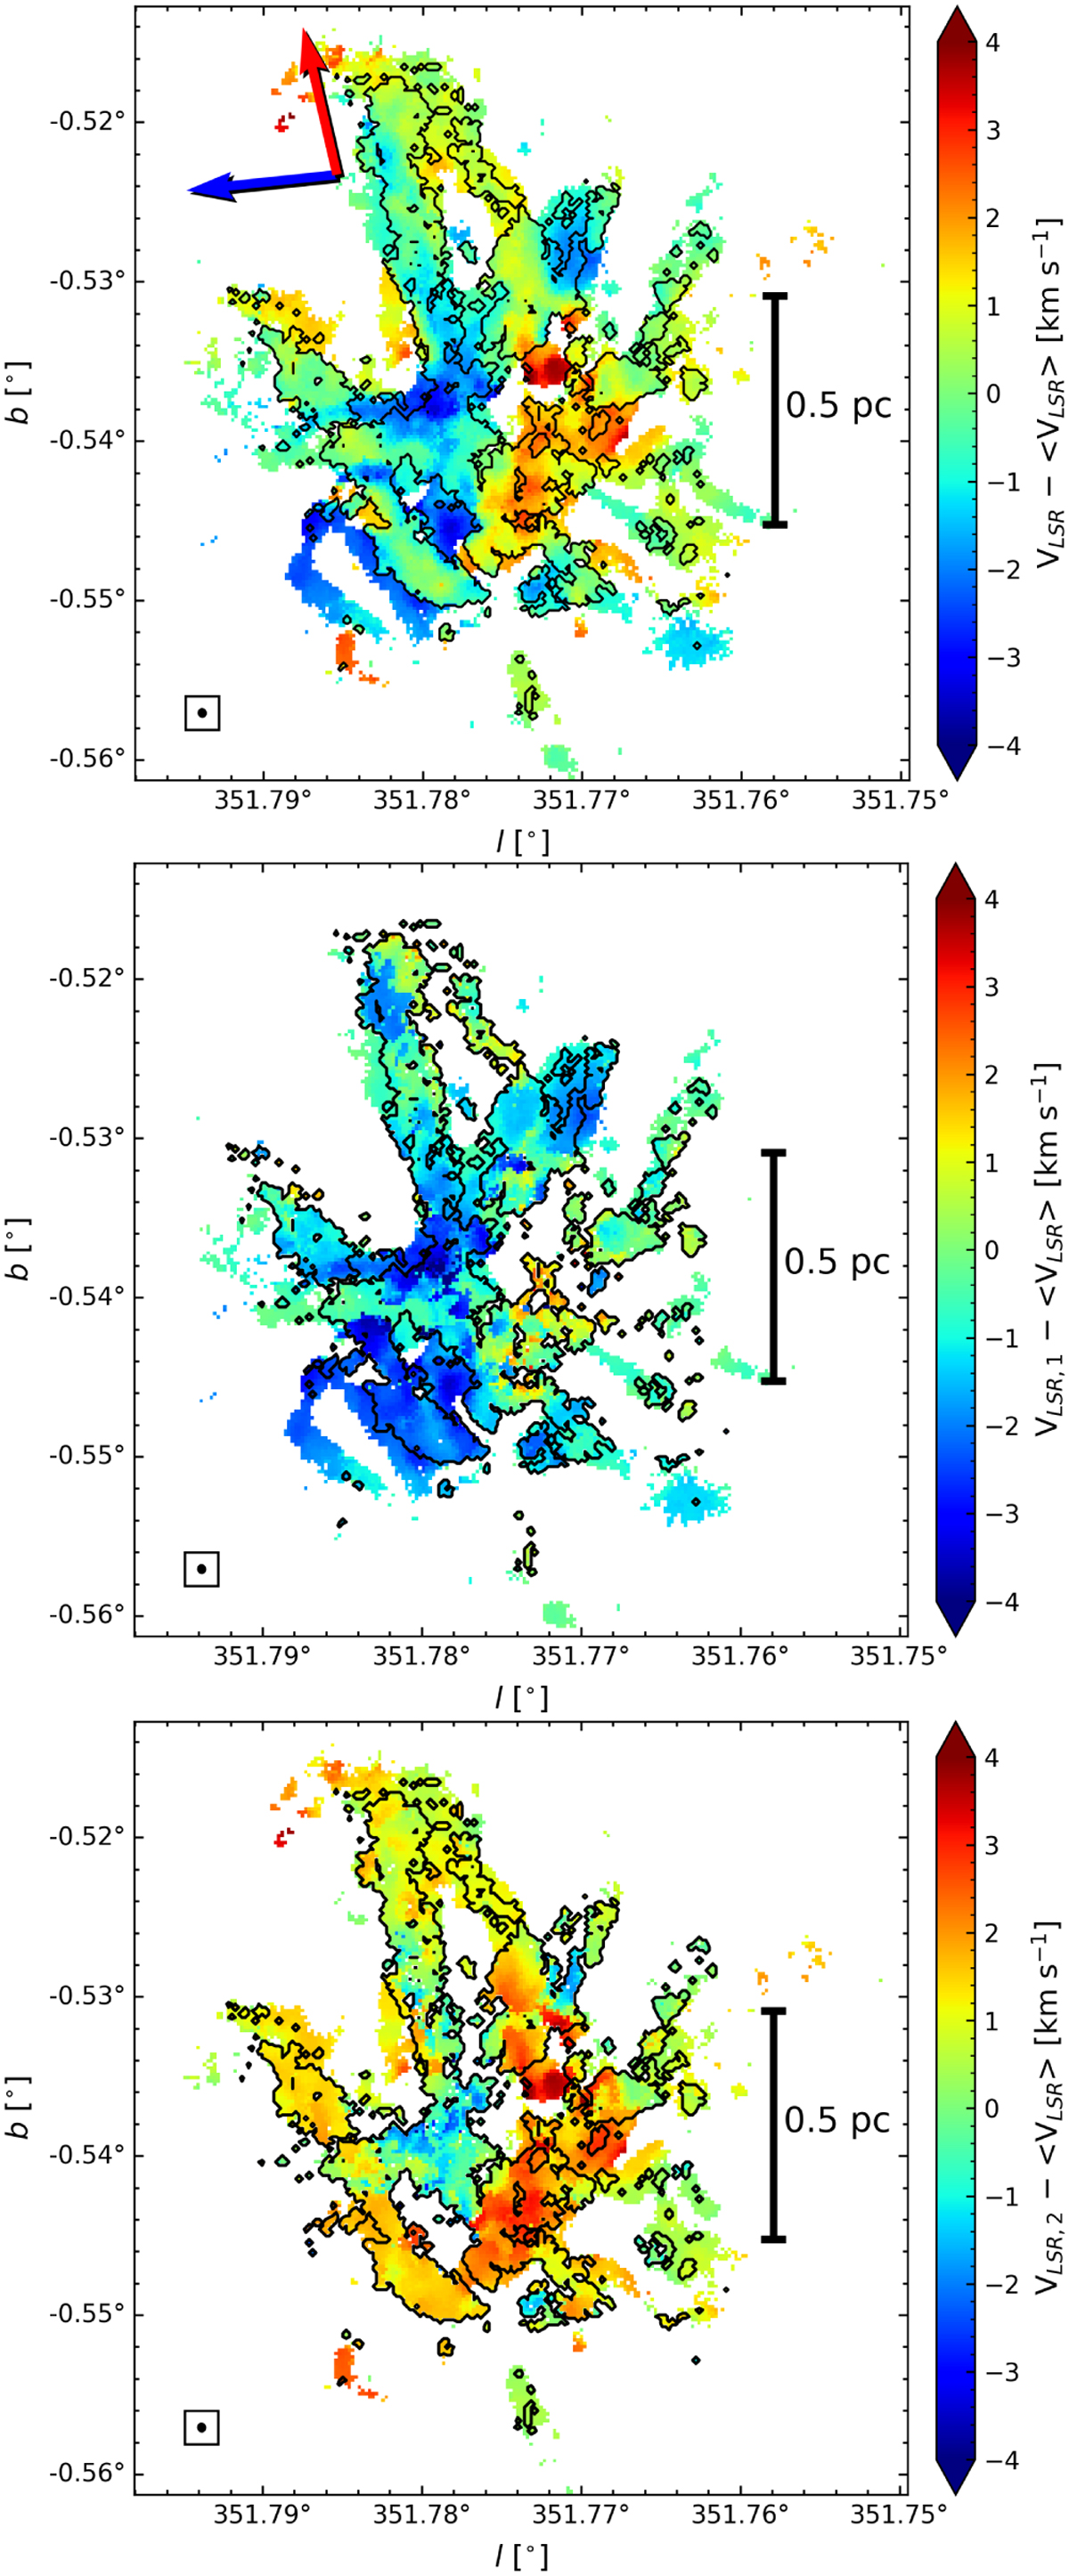
Top: mean velocity map from the final spectral model composed of both the one and two velocity components. The red arrow display the direction of the Mother Filament. The blue arrow indicates the direction of the large-scale velocity gradient measured from the centroid velocities. Middle: centroid velocity map of the blue velocity component. Bottom: centroid velocity map of the red velocity component. The spectra inside the black contour are fit with two velocity components. The ellipse in the bottom left corner represents the beam size of the N2H+ data.
Current usage metrics show cumulative count of Article Views (full-text article views including HTML views, PDF and ePub downloads, according to the available data) and Abstracts Views on Vision4Press platform.
Data correspond to usage on the plateform after 2015. The current usage metrics is available 48-96 hours after online publication and is updated daily on week days.
Initial download of the metrics may take a while.