Fig. 5
Download original image
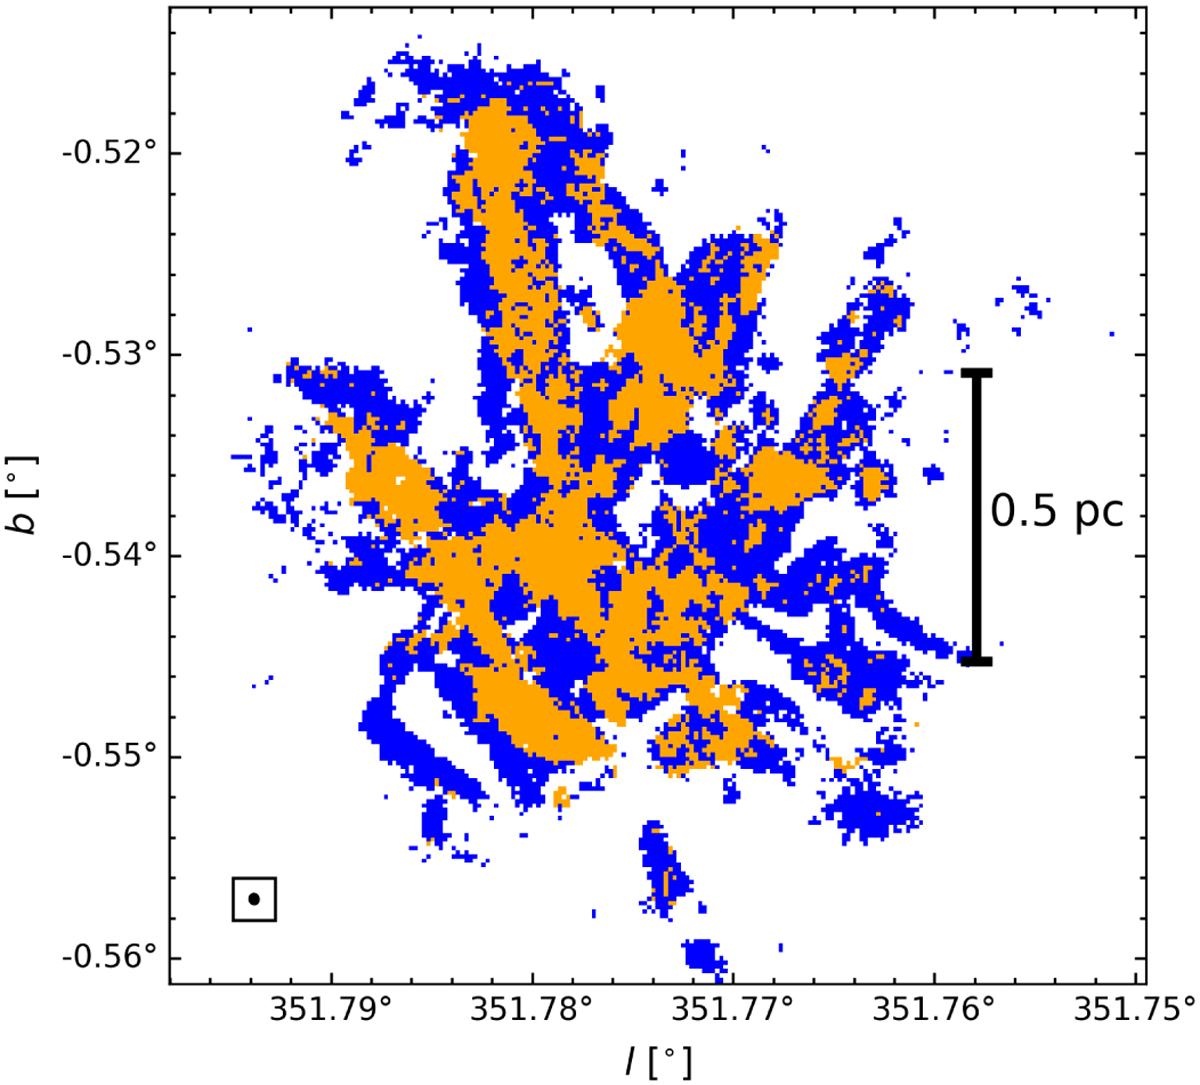
Map of the number of velocity components in the N2H+ (1–0) spectral fits in the G351.77 protocluster. The blue (orange) pixels represent 59% (41%) of the spectra where we adopt a one-velocity-component fit (two-velocity-components fit), see Sect. 3.3. Most of the orange pixels are located in central regions, where we observe the highest S/N and integrated intensity values, similar to the results for G353.41 (Álvarez-Gutiérrez et al. 2024). The blue areas are located preferentially near the edges. The ellipse in the bottom left corner represents the beam size of the N2H+ data.
Current usage metrics show cumulative count of Article Views (full-text article views including HTML views, PDF and ePub downloads, according to the available data) and Abstracts Views on Vision4Press platform.
Data correspond to usage on the plateform after 2015. The current usage metrics is available 48-96 hours after online publication and is updated daily on week days.
Initial download of the metrics may take a while.