Fig. 4
Download original image
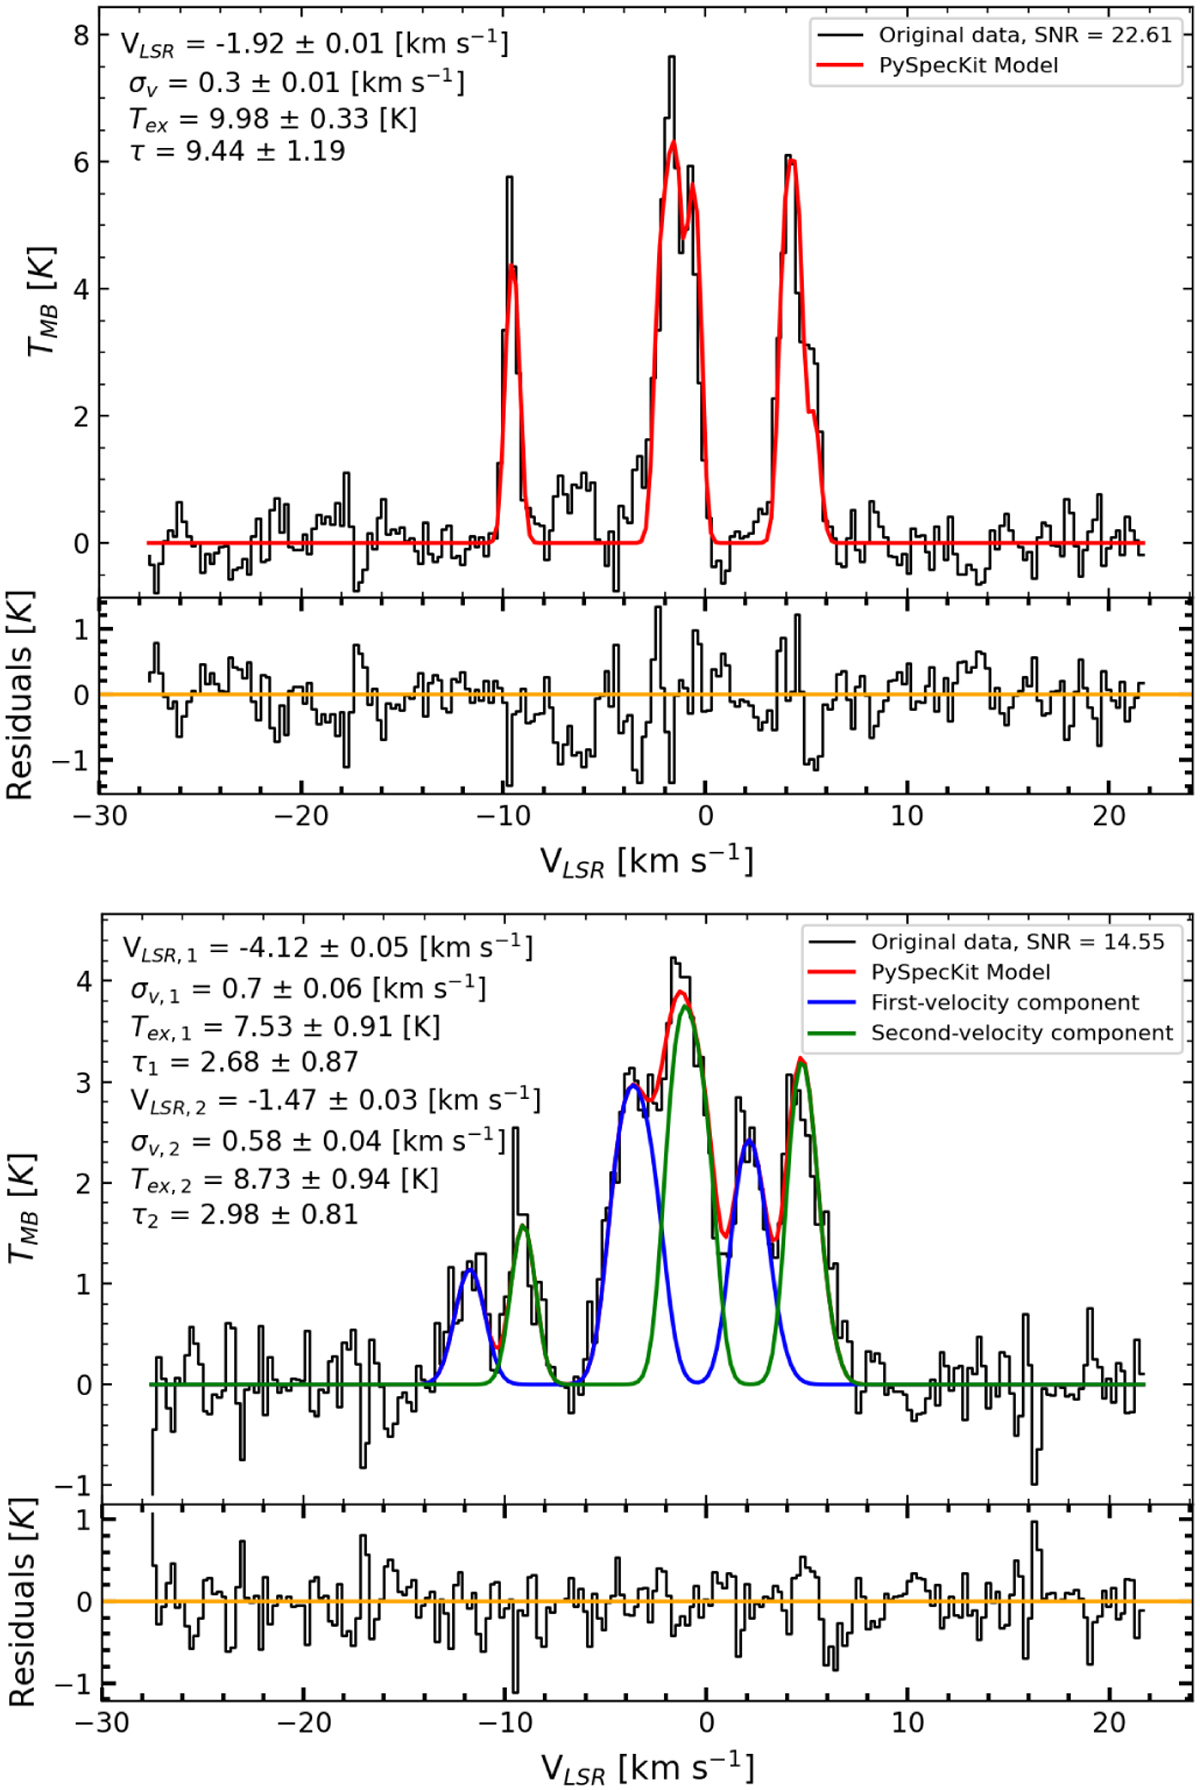
Example of one-velocity (top) and two-velocity (bottom) component fits to two different spectra; the former (later) corresponds to a spectrum extracted from the blue (orange) areas in Fig. 5. In both panels: the data are represented on the top (solid black histograms) with their corresponding fits (colored curves), and the residuals are shown on the bottom, here the orange line refers to the nil value. The S/N of each spectrum, as well as the best-fit parameter values, are listed in each panel. In the bottom panel, the red curve represents the sum over the two velocity components.
Current usage metrics show cumulative count of Article Views (full-text article views including HTML views, PDF and ePub downloads, according to the available data) and Abstracts Views on Vision4Press platform.
Data correspond to usage on the plateform after 2015. The current usage metrics is available 48-96 hours after online publication and is updated daily on week days.
Initial download of the metrics may take a while.