Fig. 3
Download original image
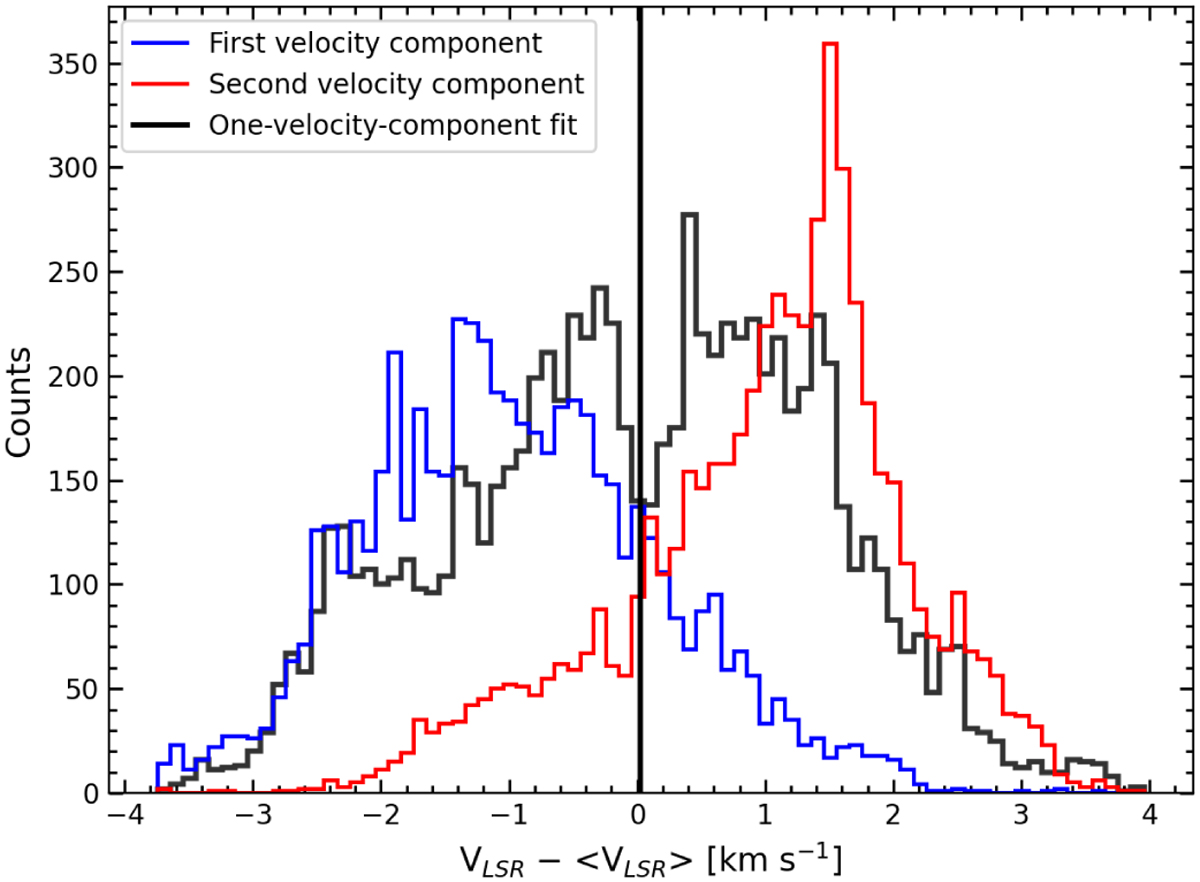
Centroid velocity distributions of the one- and two-velocity-components fits. The black histogram represents the centroid velocity distribution of the spectra fit by the one-velocity-component model. The blue and red histograms show the centroid velocity distributions of the spectra fit with the two-velocity-components model, where blue corresponds to the first velocity component and red to the second velocity component. The solid black line represents the middle point X located at 0.025 km s−1, measured via Eq. (1) (see text). This divides the black histogram into two velocities, as explained in Sect. 3.4.
Current usage metrics show cumulative count of Article Views (full-text article views including HTML views, PDF and ePub downloads, according to the available data) and Abstracts Views on Vision4Press platform.
Data correspond to usage on the plateform after 2015. The current usage metrics is available 48-96 hours after online publication and is updated daily on week days.
Initial download of the metrics may take a while.