Fig. F.5
Download original image
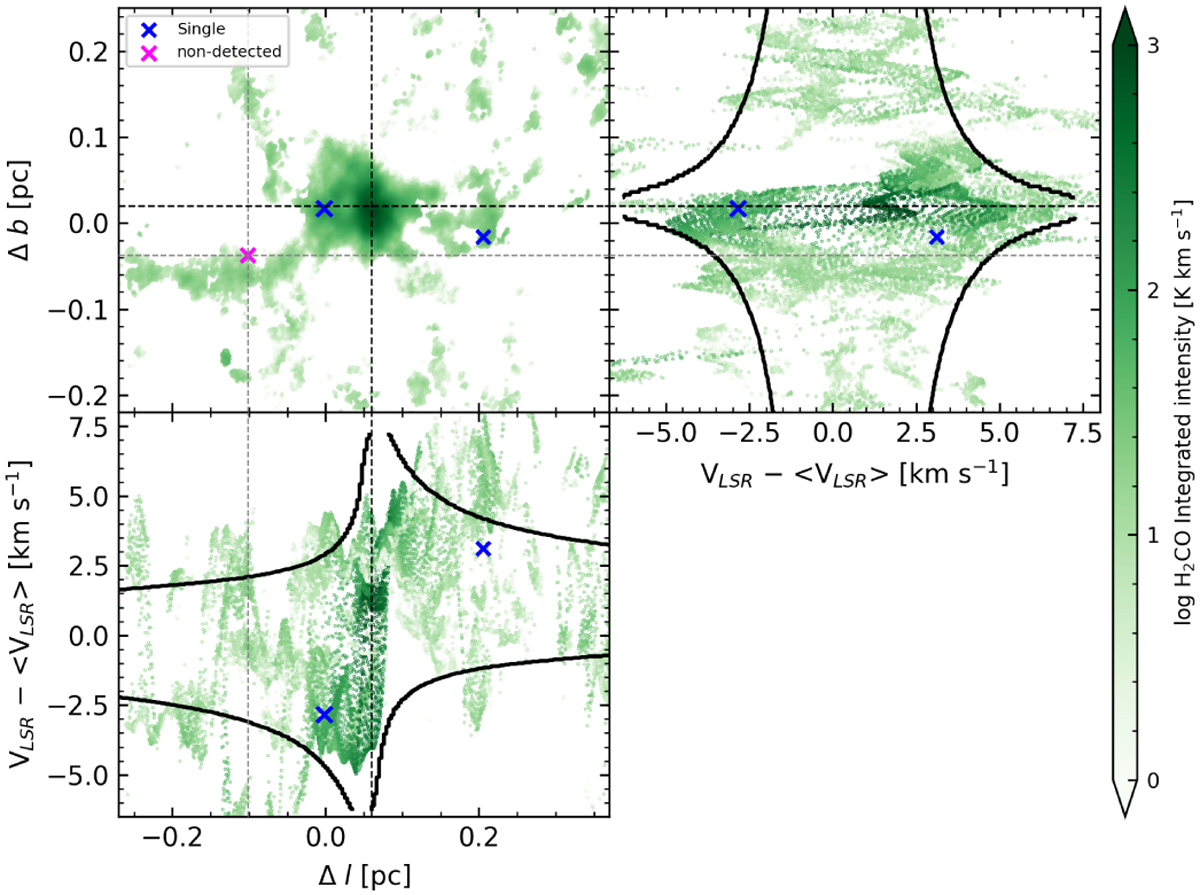
Integrated intensity and PV diagrams of the H2CO emission. Top left: Spatial distribution of H2CO emission in G351.77. The blue and magenta × markers indicate the position of the dense cores (Louvet et al. 2024), where each color represents the Cunningham et al. (2023) DCN spectral classification: single, and non-detected, respectively. Dashed gray curves indicate the positions of the dense cores that do not have identifiable velocities (non-detected). The intersection of the dashed black curves represent the center of the rotating and infalling modeled sphere (see Appendix F). Top right and bottom left: PV diagrams along the two perpendicular directions. The black contours represent the PV features produced by a rotating and infalling modeled sphere in the PV diagram.
Current usage metrics show cumulative count of Article Views (full-text article views including HTML views, PDF and ePub downloads, according to the available data) and Abstracts Views on Vision4Press platform.
Data correspond to usage on the plateform after 2015. The current usage metrics is available 48-96 hours after online publication and is updated daily on week days.
Initial download of the metrics may take a while.