Fig. D.2
Download original image
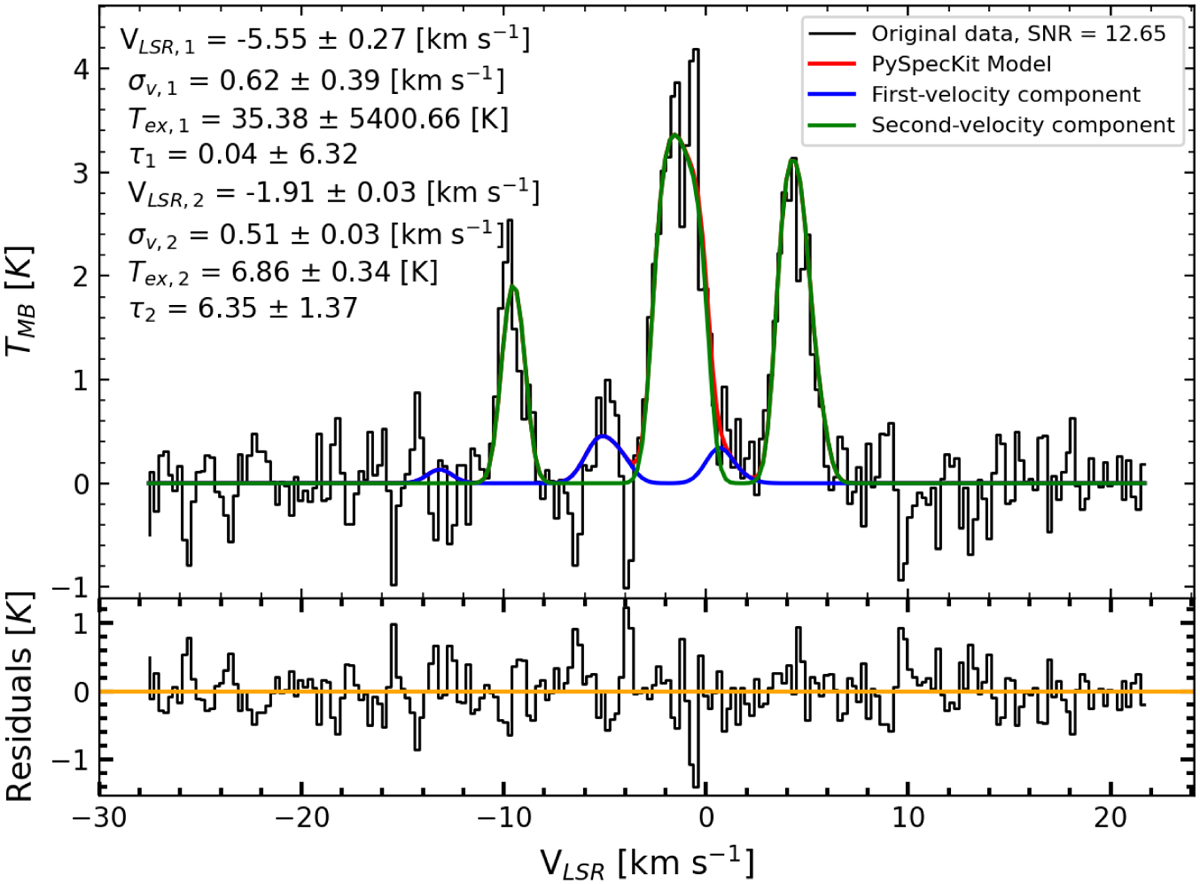
Example of two-velocity-components fits. The N2H+ data is represented by the histogram with their corresponding fits (colored curves), and the residuals are shown on the bottom panel. The orange line refers to the nil value. The intensity peak of the first velocity component is similar as what we measure for noise, indicating that it is not possible to fit two velocity components in the spectrum.
Current usage metrics show cumulative count of Article Views (full-text article views including HTML views, PDF and ePub downloads, according to the available data) and Abstracts Views on Vision4Press platform.
Data correspond to usage on the plateform after 2015. The current usage metrics is available 48-96 hours after online publication and is updated daily on week days.
Initial download of the metrics may take a while.