Fig. 2
Download original image
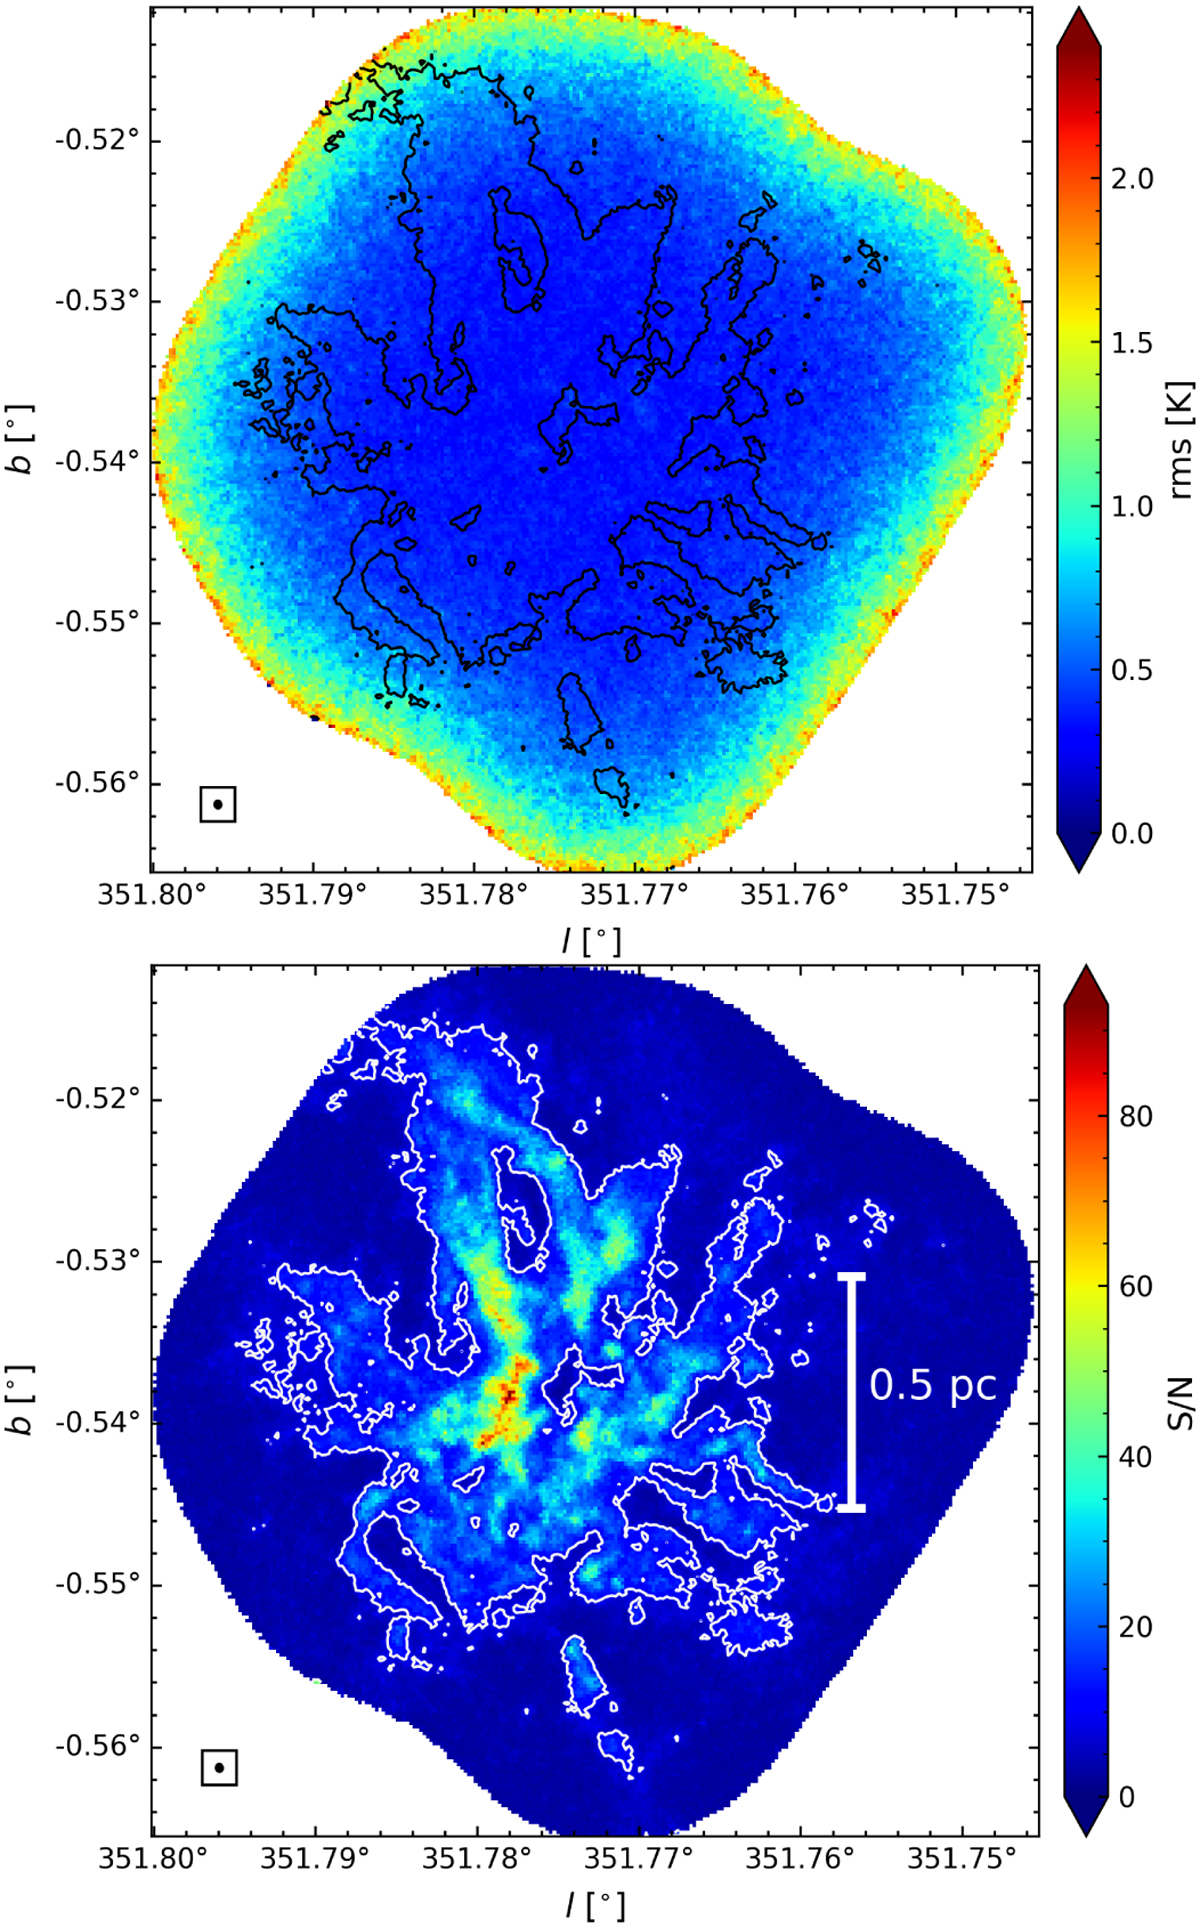
Top: noise map of the fully combined N2H+ image (see text) in the G351.77 protocluster. The spectra with the highest noise values are located near the edges, as was expected. The mean rms value across the entire map is ~0.66 K, whereas the mean value in regions with S/N > 9 is ~0.40 K. Bottom: signal-to-noise ratio (S/N) map. Spectra with high S/N are distributed following filamentary structures. The contours show the areas where spectra with S/N ≥ 9 are found (see Appendix B). The ellipse in the bottom left corner represents the final beam size of the N2H+ data of 2.3″ × 2.1″, or 4.6 kau × 4.2 kau.
Current usage metrics show cumulative count of Article Views (full-text article views including HTML views, PDF and ePub downloads, according to the available data) and Abstracts Views on Vision4Press platform.
Data correspond to usage on the plateform after 2015. The current usage metrics is available 48-96 hours after online publication and is updated daily on week days.
Initial download of the metrics may take a while.