Fig. B.1
Download original image
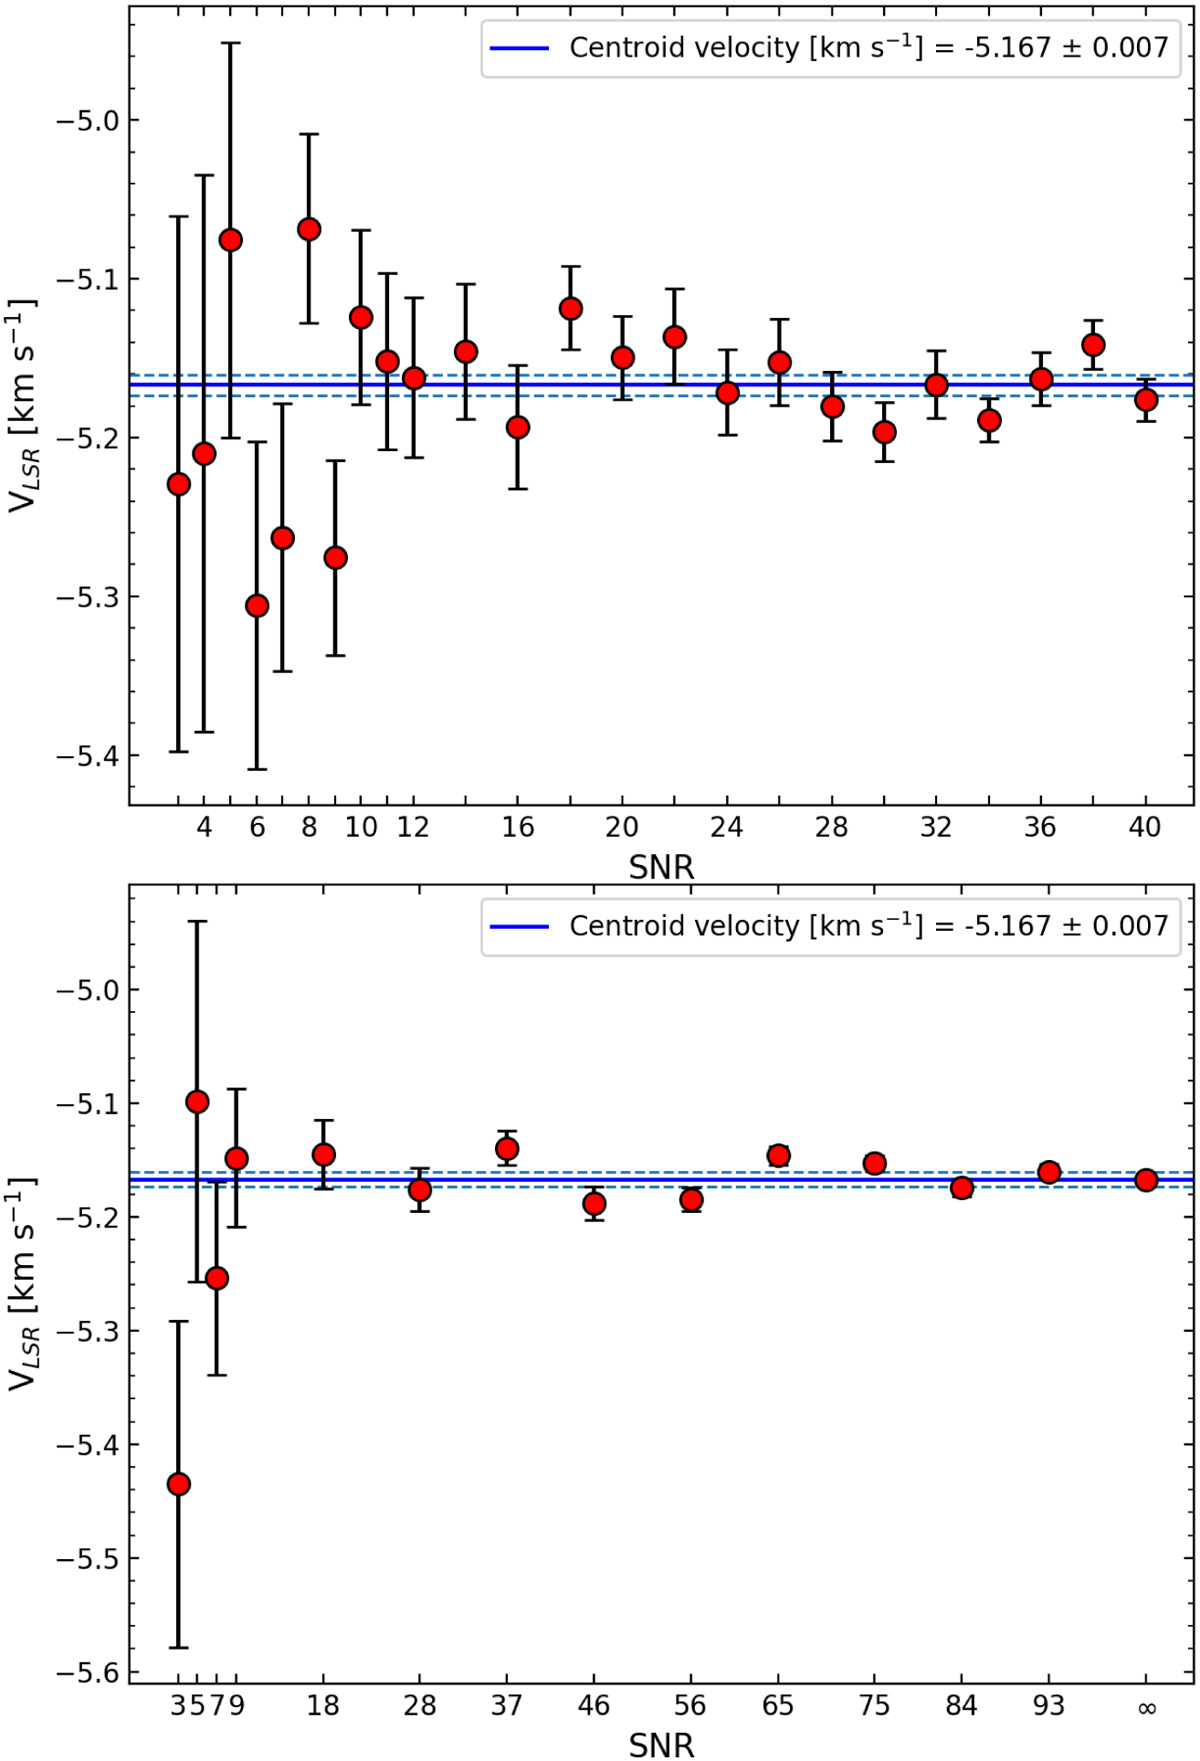
Example of the experiment fitting one velocity component (top) and two velocity components (bottom). The red points represent the centroid velocity value of the output models. The solid blue line shows the centroid velocity of the input model, while the dashed blue lines represent the range of the associated error. The error values increase as the S/N decreases. The discrepancy between the centroid velocity values of the output models and the input model increases as the S/N decreases, as we expected.
Current usage metrics show cumulative count of Article Views (full-text article views including HTML views, PDF and ePub downloads, according to the available data) and Abstracts Views on Vision4Press platform.
Data correspond to usage on the plateform after 2015. The current usage metrics is available 48-96 hours after online publication and is updated daily on week days.
Initial download of the metrics may take a while.