Fig. 17
Download original image
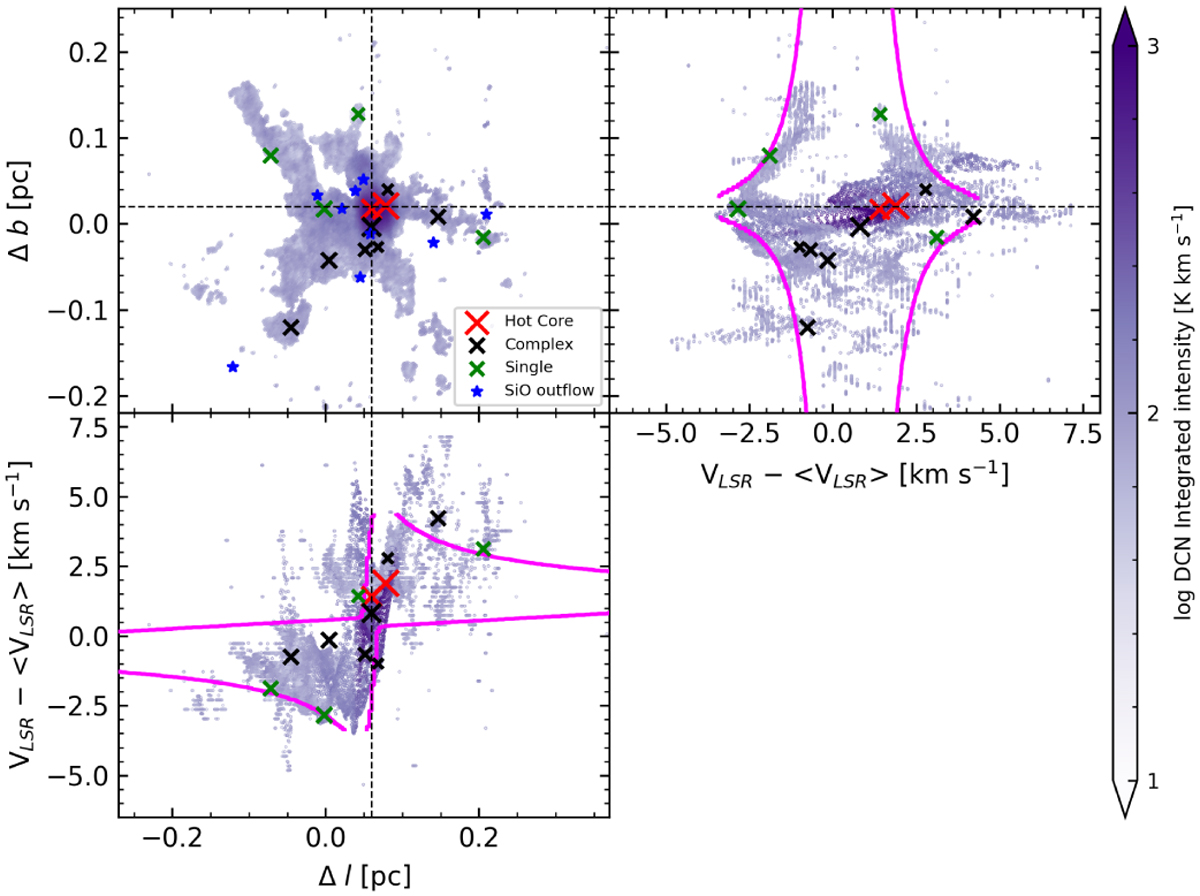
Integrated intensity and PV diagrams of the DCN (3–2) emission. Top left: spatial distribution of DCN emission in G351.77. The green, black, and red × markers indicate the position of the dense cores (Louvet et al. 2024), where green and black represent the Cunningham et al. (2023) DCN spectral classification: single, and complex, respectively, and red indicates hot cores (also complex Bonfand et al. 2024). The blue stars indicate the position of the cataloged SiO outflows in G351.77, which are not associated with observed PV-features neither to range of velocities of DCN (Towner et al. 2024). The intersection of the dashed black curves represent the center of the rotating modeled sphere (see Appendix F). Top right and bottom left: PV diagrams along the two perpendicular directions. The magenta contours represent the PV features produced by a rotating modeled sphere in the PV diagram.
Current usage metrics show cumulative count of Article Views (full-text article views including HTML views, PDF and ePub downloads, according to the available data) and Abstracts Views on Vision4Press platform.
Data correspond to usage on the plateform after 2015. The current usage metrics is available 48-96 hours after online publication and is updated daily on week days.
Initial download of the metrics may take a while.