Fig. 15
Download original image
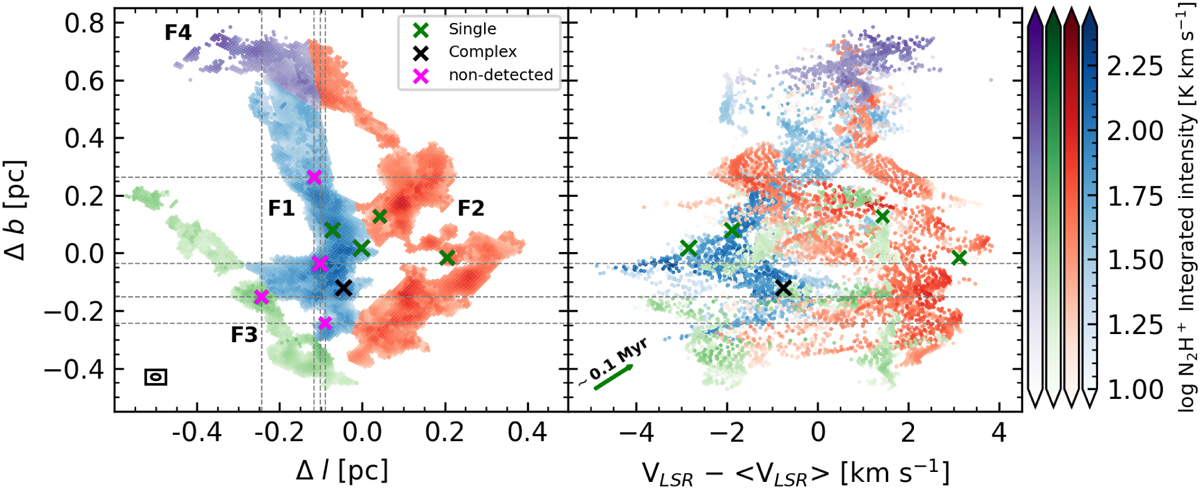
Integrated intensity and PV diagram of the F1 (blue color bar), F2 (red color bar), F3 (green color bar), and F4 (purple color bar) largescale structures of N2H+ (1–0) into which the protocluster has been divided. Left: Spatial distribution of N2H+ (1–0) emission. Markers and dashed lines are the same as in Fig. 11. The ellipse in the bottom left represents the beam size of the N2H+ data. Right: PV diagram. We observe multiple large-scale V-shapes and straight shapes along the different filamentary structures, with some of them associated with dense cores in position and in velocity. The green arrows represent a velocity gradient of 10 km s−1 pc−1, which correspond to a timescale of ~0.1 Myr.
Current usage metrics show cumulative count of Article Views (full-text article views including HTML views, PDF and ePub downloads, according to the available data) and Abstracts Views on Vision4Press platform.
Data correspond to usage on the plateform after 2015. The current usage metrics is available 48-96 hours after online publication and is updated daily on week days.
Initial download of the metrics may take a while.